
Advertisement

EnerSys (NYSE:ENS) closed yesterday at $57.75, which left some investors asking whether the high earnings potential can still be justified at this price. Let’s look into this by assessing ENS's expected growth over the next few years.
Check out our latest analysis for EnerSys
Exciting times ahead?
EnerSys's growth potential is very attractive. The consensus forecast from 3 analysts is extremely bullish with earnings per share estimated to surge from current levels of $3.836 to $6.761 over the next three years. On average, this leads to a growth rate of 21% each year, which indicates an exceedlingly positive future in the near term.
Is ENS's share price justified by its earnings growth?
EnerSys is trading at quite low price-to-earnings (PE) ratio of 15.05x. This tells us the stock is undervalued relative to the current US market average of 17.31x , and undervalued based on its latest annual earnings update compared to the Electrical average of 15.06x .
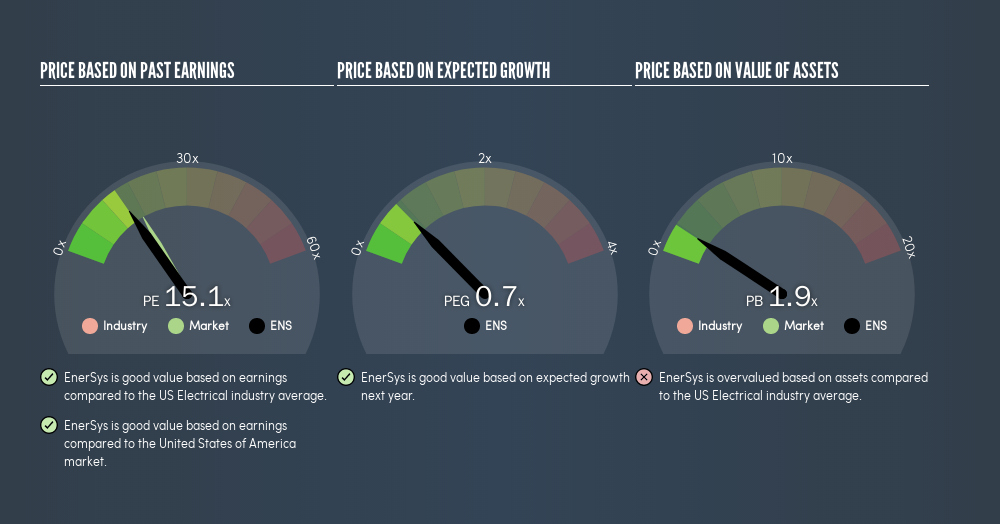
We already know that ENS appears to be undervalued based on its PE ratio, compared to the industry average. However, to properly examine the value of a high-growth stock such as EnerSys, we must reflect its earnings growth into the valuation. I find that the PEG ratio is simple yet effective for this exercise. A PE ratio of 15.05x and expected year-on-year earnings growth of 21% give EnerSys a very low PEG ratio of 0.73x. So, when we include the growth factor in our analysis, EnerSys appears relatively cheap , based on the fundamentals.
What this means for you:
ENS's current undervaluation could signal a potential buying opportunity to increase your exposure to the stock, or it you're a potential investor, now may be the right time to buy. However, basing your investment decision off one metric alone is certainly not sufficient. There are many things I have not taken into account in this article and the PEG ratio is very one-dimensional. If you have not done so already, I urge you to complete your research by taking a look at the following:
- Financial Health: Are ENS’s operations financially sustainable? Balance sheets can be hard to analyze, which is why we’ve done it for you. Check out our financial health checks here.
- Past Track Record: Has ENS been consistently performing well irrespective of the ups and downs in the market? Go into more detail in the past performance analysis and take a look at the free visual representations of ENS's historicals for more clarity.
- Other High-Performing Stocks: Are there other stocks that provide better prospects with proven track records? Explore our free list of these great stocks here.
We aim to bring you long-term focused research analysis driven by fundamental data. Note that our analysis may not factor in the latest price-sensitive company announcements or qualitative material.
If you spot an error that warrants correction, please contact the editor at editorial-team@simplywallst.com. This article by Simply Wall St is general in nature. It does not constitute a recommendation to buy or sell any stock, and does not take account of your objectives, or your financial situation. Simply Wall St has no position in the stocks mentioned. Thank you for reading.
About NYSE:ENS
EnerSys
Engages in the provision of stored energy solutions for industrial applications worldwide.
Solid track record with excellent balance sheet and pays a dividend.
Similar Companies
Market Insights

Advertisement
Community Narratives
WhiteCap Is Positioned To Profit Regardless Of Trump's Policy 
Fair Value CA$22.60|61.5% undervalued
ST
Equity Analyst and Writer
Microsoft's Evolution Will Drive Revenue to New Heights Fueled by AI
Fair Value US$360.00|30.7% overvalued
BR
Community Contributor
A CASE FOR USD$2.50 (CAD$3.44) BY 2028 (A 5-10 BAGGER)
Fair Value CA$3.44|88.1% undervalued
AG
Community Contributor