
Advertisement
Today we'll evaluate E.ON SE (FRA:EOAN) to determine whether it could have potential as an investment idea. Specifically, we're going to calculate its Return On Capital Employed (ROCE), in the hopes of getting some insight into the business.
First, we'll go over how we calculate ROCE. Next, we'll compare it to others in its industry. Then we'll determine how its current liabilities are affecting its ROCE.
Understanding Return On Capital Employed (ROCE)
ROCE measures the amount of pre-tax profits a company can generate from the capital employed in its business. Generally speaking a higher ROCE is better. In brief, it is a useful tool, but it is not without drawbacks. Author Edwin Whiting says to be careful when comparing the ROCE of different businesses, since 'No two businesses are exactly alike.'
So, How Do We Calculate ROCE?
Analysts use this formula to calculate return on capital employed:
Return on Capital Employed = Earnings Before Interest and Tax (EBIT) ÷ (Total Assets - Current Liabilities)
Or for E.ON:
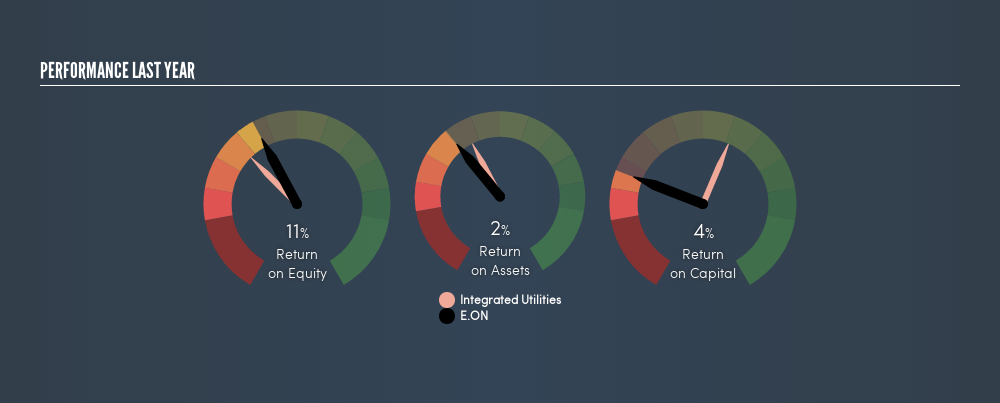
0.038 = €1.4b ÷ (€54b - €16b) (Based on the trailing twelve months to June 2019.)
Therefore, E.ON has an ROCE of 3.8%.
Check out our latest analysis for E.ON
Does E.ON Have A Good ROCE?
One way to assess ROCE is to compare similar companies. In this analysis, E.ON's ROCE appears meaningfully below the 5.1% average reported by the Integrated Utilities industry. This performance is not ideal, as it suggests the company may not be deploying its capital as effectively as some competitors. Separate from how E.ON stacks up against its industry, its ROCE in absolute terms is mediocre; relative to the returns on government bonds. Investors may wish to consider higher-performing investments.
E.ON's current ROCE of 3.8% is lower than 3 years ago, when the company reported a 15% ROCE. So investors might consider if it has had issues recently.
When considering this metric, keep in mind that it is backwards looking, and not necessarily predictive. ROCE can be misleading for companies in cyclical industries, with returns looking impressive during the boom times, but very weak during the busts. This is because ROCE only looks at one year, instead of considering returns across a whole cycle. Future performance is what matters, and you can see analyst predictions in our free report on analyst forecasts for the company.
Do E.ON's Current Liabilities Skew Its ROCE?
Short term (or current) liabilities, are things like supplier invoices, overdrafts, or tax bills that need to be paid within 12 months. Due to the way ROCE is calculated, a high level of current liabilities makes a company look as though it has less capital employed, and thus can (sometimes unfairly) boost the ROCE. To counteract this, we check if a company has high current liabilities, relative to its total assets.
E.ON has total assets of €54b and current liabilities of €16b. As a result, its current liabilities are equal to approximately 29% of its total assets. This very reasonable level of current liabilities would not boost the ROCE by much.
What We Can Learn From E.ON's ROCE
If E.ON continues to earn an uninspiring ROCE, there may be better places to invest. You might be able to find a better investment than E.ON. If you want a selection of possible winners, check out this free list of interesting companies that trade on a P/E below 20 (but have proven they can grow earnings).
If you are like me, then you will not want to miss this free list of growing companies that insiders are buying.
We aim to bring you long-term focused research analysis driven by fundamental data. Note that our analysis may not factor in the latest price-sensitive company announcements or qualitative material.
If you spot an error that warrants correction, please contact the editor at editorial-team@simplywallst.com. This article by Simply Wall St is general in nature. It does not constitute a recommendation to buy or sell any stock, and does not take account of your objectives, or your financial situation. Simply Wall St has no position in the stocks mentioned. Thank you for reading.
About DB:EOAN
E.ON
Operates as an energy company in Germany, the United Kingdom, Sweden, the Netherlands, rest of Europe, and internationally.
Solid track record and fair value.
Similar Companies
Market Insights

Advertisement
Community Narratives
WhiteCap Is Positioned To Profit Regardless Of Trump's Policy 
Fair Value CA$22.60|61.5% undervalued
ST
Equity Analyst and Writer
Microsoft's Evolution Will Drive Revenue to New Heights Fueled by AI
Fair Value US$360.00|30.7% overvalued
BR
Community Contributor
A CASE FOR USD$2.50 (CAD$3.44) BY 2028 (A 5-10 BAGGER)
Fair Value CA$3.44|88.1% undervalued
AG
Community Contributor