Advertisement
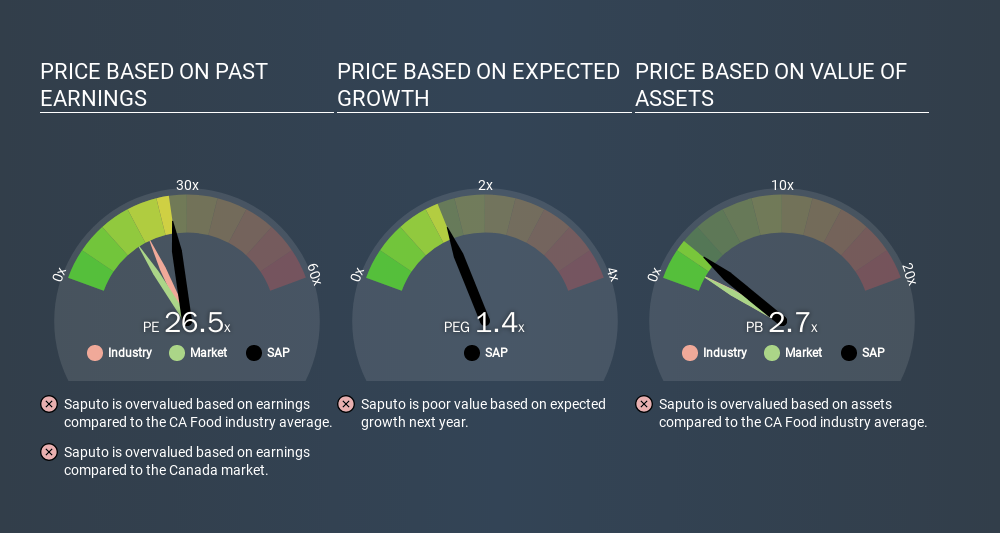
Today, we'll introduce the concept of the P/E ratio for those who are learning about investing. We'll show how you can use Saputo Inc.'s (TSE:SAP) P/E ratio to inform your assessment of the investment opportunity. Saputo has a P/E ratio of 26.48, based on the last twelve months. That corresponds to an earnings yield of approximately 3.8%.
See our latest analysis for Saputo
How Do You Calculate Saputo's P/E Ratio?
The formula for P/E is:
Price to Earnings Ratio = Price per Share ÷ Earnings per Share (EPS)
Or for Saputo:
P/E of 26.48 = CAD41.40 ÷ CAD1.56 (Based on the trailing twelve months to December 2019.)
Is A High P/E Ratio Good?
A higher P/E ratio means that investors are paying a higher price for each CAD1 of company earnings. All else being equal, it's better to pay a low price -- but as Warren Buffett said, 'It's far better to buy a wonderful company at a fair price than a fair company at a wonderful price'.
How Does Saputo's P/E Ratio Compare To Its Peers?
The P/E ratio indicates whether the market has higher or lower expectations of a company. As you can see below, Saputo has a higher P/E than the average company (19.4) in the food industry.
Saputo's P/E tells us that market participants think the company will perform better than its industry peers, going forward. Clearly the market expects growth, but it isn't guaranteed. So further research is always essential. I often monitor director buying and selling.
How Growth Rates Impact P/E Ratios
If earnings fall then in the future the 'E' will be lower. That means unless the share price falls, the P/E will increase in a few years. A higher P/E should indicate the stock is expensive relative to others -- and that may encourage shareholders to sell.
Saputo's earnings per share fell by 20% in the last twelve months. But EPS is up 1.4% over the last 5 years. And over the longer term (3 years) earnings per share have decreased 4.6% annually. This might lead to low expectations.
Don't Forget: The P/E Does Not Account For Debt or Bank Deposits
Don't forget that the P/E ratio considers market capitalization. Thus, the metric does not reflect cash or debt held by the company. Theoretically, a business can improve its earnings (and produce a lower P/E in the future) by investing in growth. That means taking on debt (or spending its cash).
While growth expenditure doesn't always pay off, the point is that it is a good option to have; but one that the P/E ratio ignores.
Saputo's Balance Sheet
Saputo's net debt is 22% of its market cap. This could bring some additional risk, and reduce the number of investment options for management; worth remembering if you compare its P/E to businesses without debt.
The Verdict On Saputo's P/E Ratio
Saputo has a P/E of 26.5. That's higher than the average in its market, which is 15.9. With modest debt but no EPS growth in the last year, it's fair to say the P/E implies some optimism about future earnings, from the market.
Investors should be looking to buy stocks that the market is wrong about. If the reality for a company is better than it expects, you can make money by buying and holding for the long term. So this free visualization of the analyst consensus on future earnings could help you make the right decision about whether to buy, sell, or hold.
Of course you might be able to find a better stock than Saputo. So you may wish to see this free collection of other companies that have grown earnings strongly.
If you spot an error that warrants correction, please contact the editor at editorial-team@simplywallst.com. This article by Simply Wall St is general in nature. It does not constitute a recommendation to buy or sell any stock, and does not take account of your objectives, or your financial situation. Simply Wall St has no position in the stocks mentioned.
We aim to bring you long-term focused research analysis driven by fundamental data. Note that our analysis may not factor in the latest price-sensitive company announcements or qualitative material. Thank you for reading.
About TSX:SAP
Saputo
Produces, markets, and distributes dairy products in Canada, the United States, Australia, Argentina, and the United Kingdom.
Flawless balance sheet established dividend payer.
Similar Companies
Market Insights


Advertisement
Weekly Picks
VA


valuebull on Eva Live ·
Is this the AI replacing marketing professionals?
Fair Value:US$7.4350.9% undervalued
15 followersusers have followed this narrative
0 commentsusers have commented on this narrative
3 likesusers have liked this narrative
ZA

ZayaanS on Pro Medicus ·
Pro Medicus: The Market Is Confusing a Lumpy Quarter With a Broken Business
Fair Value:AU$196.7838.3% undervalued
26 followersusers have followed this narrative
4 commentsusers have commented on this narrative
18 likesusers have liked this narrative
ST

SteveGruber on Warner Bros. Discovery ·
The Rising Deal Risk That Helped Sink Netflix’s $72 Billion Bid for Warner Bros. Discovery
Fair Value:US$18.1754.1% overvalued
5 followersusers have followed this narrative
1 commentusers have commented on this narrative
3 likesusers have liked this narrative
PD

pdixit1 on Vertiv Holdings Co ·
The Infrastructure AI Cannot Be Built Without
Fair Value:US$408.6438.9% undervalued
32 followersusers have followed this narrative
3 commentsusers have commented on this narrative
13 likesusers have liked this narrative
Recently Updated Narratives
AS

astratov on Santos ·
Santos: Undervalued After Takeover Fallout
Fair Value:AU$8.8917.7% undervalued
1 followerusers have followed this narrative
0 commentsusers have commented on this narrative
0 likesusers have liked this narrative
AN


andre_santos on Realty Income ·
Realty Income - A Fundamental and Historical Valuation
Fair Value:US$73.4611.8% undervalued
29 followersusers have followed this narrative
0 commentsusers have commented on this narrative
0 likesusers have liked this narrative
HP

HpN on Microsoft ·
A Structured Counter‑Analysis of "The Leaking Dreadnought"
Fair Value:US$509.8219.4% undervalued
1 followerusers have followed this narrative
0 commentsusers have commented on this narrative
0 likesusers have liked this narrative
Popular Narratives
DA


davidlsander on Ubisoft Entertainment ·
Is Ubisoft the Market’s Biggest Pricing Error? Why Forensic Value Points to €33 Per Share
Fair Value:€33.888.2% undervalued
65 followersusers have followed this narrative
5 commentsusers have commented on this narrative
28 likesusers have liked this narrative
KA

kabz2342 on Nu Holdings ·
Nu holdings will continue to disrupt the South American banking market
Fair Value:US$64.377.0% undervalued
48 followersusers have followed this narrative
3 commentsusers have commented on this narrative
27 likesusers have liked this narrative
AN

AnalystConsensusTarget on Microsoft ·
Analyst Commentary Highlights Microsoft AI Momentum and Upward Valuation Amid Growth and Competitive Risks
Fair Value:US$59631.1% undervalued
1298 followersusers have followed this narrative
2 commentsusers have commented on this narrative
10 likesusers have liked this narrative

