
Advertisement
Howard Marks put it nicely when he said that, rather than worrying about share price volatility, 'The possibility of permanent loss is the risk I worry about... and every practical investor I know worries about. It's only natural to consider a company's balance sheet when you examine how risky it is, since debt is often involved when a business collapses. We can see that Metsä Board Oyj (HEL:METSB) does use debt in its business. But should shareholders be worried about its use of debt?
When Is Debt A Problem?
Generally speaking, debt only becomes a real problem when a company can't easily pay it off, either by raising capital or with its own cash flow. If things get really bad, the lenders can take control of the business. While that is not too common, we often do see indebted companies permanently diluting shareholders because lenders force them to raise capital at a distressed price. Of course, debt can be an important tool in businesses, particularly capital heavy businesses. The first thing to do when considering how much debt a business uses is to look at its cash and debt together.
Check out our latest analysis for Metsä Board Oyj
How Much Debt Does Metsä Board Oyj Carry?
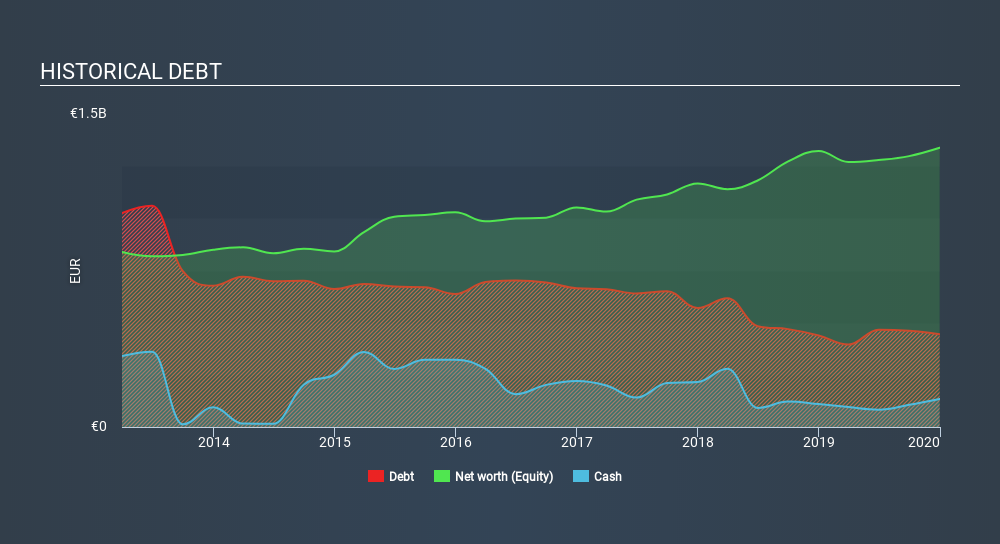
The chart below, which you can click on for greater detail, shows that Metsä Board Oyj had €436.4m in debt in December 2019; about the same as the year before. However, it also had €134.2m in cash, and so its net debt is €302.2m.
A Look At Metsä Board Oyj's Liabilities
The latest balance sheet data shows that Metsä Board Oyj had liabilities of €391.0m due within a year, and liabilities of €541.4m falling due after that. On the other hand, it had cash of €134.2m and €322.8m worth of receivables due within a year. So it has liabilities totalling €475.4m more than its cash and near-term receivables, combined.
This deficit isn't so bad because Metsä Board Oyj is worth €1.90b, and thus could probably raise enough capital to shore up its balance sheet, if the need arose. However, it is still worthwhile taking a close look at its ability to pay off debt.
We use two main ratios to inform us about debt levels relative to earnings. The first is net debt divided by earnings before interest, tax, depreciation, and amortization (EBITDA), while the second is how many times its earnings before interest and tax (EBIT) covers its interest expense (or its interest cover, for short). Thus we consider debt relative to earnings both with and without depreciation and amortization expenses.
Metsä Board Oyj has net debt of just 1.4 times EBITDA, indicating that it is certainly not a reckless borrower. And it boasts interest cover of 8.9 times, which is more than adequate. Fortunately, Metsä Board Oyj grew its EBIT by 5.2% in the last year, making that debt load look even more manageable. There's no doubt that we learn most about debt from the balance sheet. But it is future earnings, more than anything, that will determine Metsä Board Oyj's ability to maintain a healthy balance sheet going forward. So if you're focused on the future you can check out this free report showing analyst profit forecasts.
Finally, a company can only pay off debt with cold hard cash, not accounting profits. So we clearly need to look at whether that EBIT is leading to corresponding free cash flow. Happily for any shareholders, Metsä Board Oyj actually produced more free cash flow than EBIT over the last three years. There's nothing better than incoming cash when it comes to staying in your lenders' good graces.
Our View
Happily, Metsä Board Oyj's impressive conversion of EBIT to free cash flow implies it has the upper hand on its debt. And the good news does not stop there, as its interest cover also supports that impression! Taking all this data into account, it seems to us that Metsä Board Oyj takes a pretty sensible approach to debt. That means they are taking on a bit more risk, in the hope of boosting shareholder returns. The balance sheet is clearly the area to focus on when you are analysing debt. However, not all investment risk resides within the balance sheet - far from it. Case in point: We've spotted 1 warning sign for Metsä Board Oyj you should be aware of.
If you're interested in investing in businesses that can grow profits without the burden of debt, then check out this free list of growing businesses that have net cash on the balance sheet.
If you spot an error that warrants correction, please contact the editor at editorial-team@simplywallst.com. This article by Simply Wall St is general in nature. It does not constitute a recommendation to buy or sell any stock, and does not take account of your objectives, or your financial situation. Simply Wall St has no position in the stocks mentioned.
We aim to bring you long-term focused research analysis driven by fundamental data. Note that our analysis may not factor in the latest price-sensitive company announcements or qualitative material. Thank you for reading.
About HLSE:METSB
Metsä Board Oyj
Engages in the folding boxboard, fresh fibre linerboard, and market pulp businesses in Finland and internationally.
Good value with reasonable growth potential.
Similar Companies
Market Insights


Advertisement
Weekly Picks
DA


davidlsander on Optimi Health ·
OPTH: A licensed manufacturer already selling MDMA while peers still wait on trials
Fair Value:US$1261.0% undervalued
15 followersusers have followed this narrative
0 commentsusers have commented on this narrative
2 likesusers have liked this narrative
FU

FundamentalFlow on Vertiv Holdings Co ·
The Short and Long Term Compounder of Liquid Cooling industry.
Fair Value:US$45037.4% undervalued
9 followersusers have followed this narrative
0 commentsusers have commented on this narrative
4 likesusers have liked this narrative
JO


John_Eric on SPX Technologies ·
I Fell in Love With a Data-Center Cooling Stock. Then I Opened the Filings.
Fair Value:US$2036.8% overvalued
6 followersusers have followed this narrative
0 commentsusers have commented on this narrative
3 likesusers have liked this narrative
TR


tripledub on GQG Partners ·
The Cheap Genius Problem
Fair Value:AU$2.4541.2% undervalued
16 followersusers have followed this narrative
0 commentsusers have commented on this narrative
18 likesusers have liked this narrative
Recently Updated Narratives
RC

rcb9 on Palantir Technologies ·
The Fifty-Five Percent Margin Is A Tax Holiday, Not The Business
Fair Value:US$91.8590.5% overvalued
1 followerusers have followed this narrative
0 commentsusers have commented on this narrative
0 likesusers have liked this narrative
KL

Klim on PetroTal ·
PetroTal: Betting On a Production Recovery
Fair Value:CA$0.8542.4% undervalued
1 followerusers have followed this narrative
0 commentsusers have commented on this narrative
0 likesusers have liked this narrative
DA

david_1211213 on Robo.ai ·
Robo.ai (AIIO): A Long-Term Bullish Technical Setup
Fair Value:US$5.6447.2% undervalued
1 followerusers have followed this narrative
3 commentsusers have commented on this narrative
0 likesusers have liked this narrative
Popular Narratives
OS


oscargarcia on NVIDIA ·
The company that went from selling GPUs to gamers to becoming the AI arms dealer of the 21st century.
Fair Value:US$28022.3% undervalued
296 followersusers have followed this narrative
9 commentsusers have commented on this narrative
16 likesusers have liked this narrative
CU

CubanEros on Microsoft ·
A wonderful business at reasonable price.
Fair Value:US$419.9120.0% overvalued
158 followersusers have followed this narrative
0 commentsusers have commented on this narrative
8 likesusers have liked this narrative
KI

KiwiInvest on Amazon.com ·
Amazon's high growth, high tech segments propel its profits, while traditional segments plod along
Fair Value:US$475.0942.7% undervalued
178 followersusers have followed this narrative
1 commentusers have commented on this narrative
8 likesusers have liked this narrative
Trending Discussion

IA

ian_oii7z on Woodside Energy Group ·
Hey James! Thank you but I am not sure if I am reading this correctly as your analysis opens with "At A$36.602 per share, Woodside Energy Group (ASX: WDS) appears reasonably valued based on its existing operations and near-term production growth." I would like to say that the last time that WDS was above $36.00 per share was in October 2023, so I am a little confused by your statement w.r.t. current prices etc . Can you please explain?
1
|0
M0

m00sekateer on Pony AI ·
Checked it. The arithmetic is fine; the inputs aren't, and the conclusion doesn't follow even if they were.1. Fare. $7 is a US robotaxi price. Pony's record peak day in Shenzhen (22 March 2026) was RMB394 net revenue per Gen-7 vehicle on 25 orders — about US$2.20 per order. You're roughly 3x high.2. Utilisation. 25 orders/day is Pony's all-time single-day high, not an average, and you then run it 365 days with zero downtime for charging, cleaning, maintenance, weather or geofence interruption.Corrected, the best day Pony has ever recorded yields ~US$55/day. On $43k of hardware that's ~26 months of gross revenue, before any operating cost. The reported actuals agree: FY2025 robotaxi services revenue US$16.6m on a fleet just past 1,000 units; Q1 2026 US$8.6m with the fleet above 1,700 — call it US$20–25k per vehicle per year against your $63,875.3. The caveat is the whole argument. You flag "not including operational costs (people costs)" and then set it aside. Remote safety operators, platform commissions, charging, insurance, cleaning, depot and maintenance are what determine whether a robotaxi contributes anything at all.4. Payback isn't profitability. Q1 2026: 16.2% gross margin on US$34.3m revenue, US$63.9m of opex, US$53.5m net loss. Marginal hardware payback says nothing about R&D, mapping, licensing or overhead.5. Falling BOM cuts both ways. Pony targets sub-RMB230k (~US$34k) total vehicle cost for 2027. Great for new units, bad for the residual value of fleets already deployed on a five-year depreciation schedule.What you get right: the cost trajectory is real, and city-wide UE breakeven in Guangzhou (Nov 2025) and Shenzhen (Feb 2026) is a genuine milestone. But that is contribution-margin breakeven per trip — not "cracked the per-unit cost," and not an 8-month payback. Your post predates all of it; the data has since landed, and it's less favourable on revenue per vehicle than the model assumed.
0
|0