
Advertisement
- United States
- /
- Chemicals
- /
- NYSE:KRO
Do Kronos Worldwide, Inc.’s (NYSE:KRO) Returns On Capital Employed Make The Cut?

Today we are going to look at Kronos Worldwide, Inc. (NYSE:KRO) to see whether it might be an attractive investment prospect. To be precise, we'll consider its Return On Capital Employed (ROCE), as that will inform our view of the quality of the business.
First up, we'll look at what ROCE is and how we calculate it. Second, we'll look at its ROCE compared to similar companies. Last but not least, we'll look at what impact its current liabilities have on its ROCE.
Return On Capital Employed (ROCE): What is it?
ROCE is a measure of a company's yearly pre-tax profit (its return), relative to the capital employed in the business. In general, businesses with a higher ROCE are usually better quality. In brief, it is a useful tool, but it is not without drawbacks. Author Edwin Whiting says to be careful when comparing the ROCE of different businesses, since 'No two businesses are exactly alike.
So, How Do We Calculate ROCE?
The formula for calculating the return on capital employed is:
Return on Capital Employed = Earnings Before Interest and Tax (EBIT) ÷ (Total Assets - Current Liabilities)
Or for Kronos Worldwide:
0.076 = US$129m ÷ (US$2.0b - US$271m) (Based on the trailing twelve months to December 2019.)
Therefore, Kronos Worldwide has an ROCE of 7.6%.
See our latest analysis for Kronos Worldwide
Does Kronos Worldwide Have A Good ROCE?
When making comparisons between similar businesses, investors may find ROCE useful. Using our data, Kronos Worldwide's ROCE appears to be around the 8.9% average of the Chemicals industry. Setting aside the industry comparison for now, Kronos Worldwide's ROCE is mediocre in absolute terms, considering the risk of investing in stocks versus the safety of a bank account. Investors may wish to consider higher-performing investments.
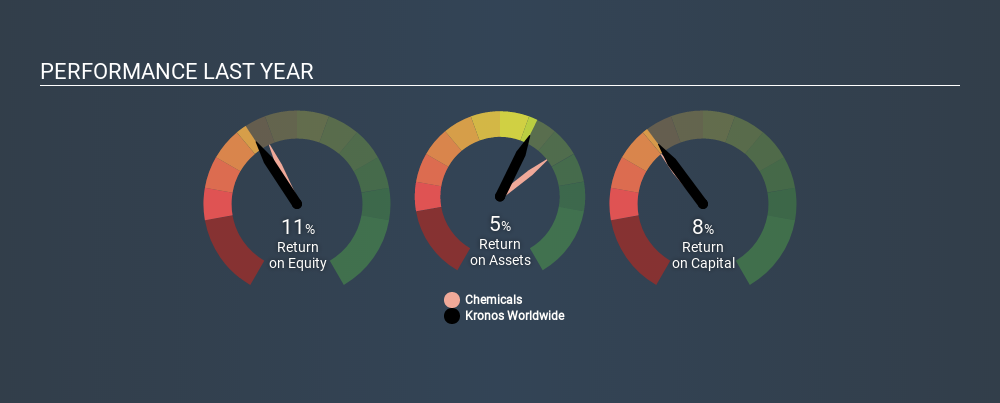
The image below shows how Kronos Worldwide's ROCE compares to its industry, and you can click it to see more detail on its past growth.
When considering this metric, keep in mind that it is backwards looking, and not necessarily predictive. ROCE can be misleading for companies in cyclical industries, with returns looking impressive during the boom times, but very weak during the busts. ROCE is only a point-in-time measure. Since the future is so important for investors, you should check out our free report on analyst forecasts for Kronos Worldwide.
How Kronos Worldwide's Current Liabilities Impact Its ROCE
Current liabilities include invoices, such as supplier payments, short-term debt, or a tax bill, that need to be paid within 12 months. Due to the way the ROCE equation works, having large bills due in the near term can make it look as though a company has less capital employed, and thus a higher ROCE than usual. To counter this, investors can check if a company has high current liabilities relative to total assets.
Kronos Worldwide has current liabilities of US$271m and total assets of US$2.0b. Therefore its current liabilities are equivalent to approximately 14% of its total assets. This is a modest level of current liabilities, which would only have a small effect on ROCE.
The Bottom Line On Kronos Worldwide's ROCE
If Kronos Worldwide continues to earn an uninspiring ROCE, there may be better places to invest. But note: make sure you look for a great company, not just the first idea you come across. So take a peek at this free list of interesting companies with strong recent earnings growth (and a P/E ratio below 20).
Kronos Worldwide is not the only stock insiders are buying. So take a peek at this free list of growing companies with insider buying.
If you spot an error that warrants correction, please contact the editor at editorial-team@simplywallst.com. This article by Simply Wall St is general in nature. It does not constitute a recommendation to buy or sell any stock, and does not take account of your objectives, or your financial situation. Simply Wall St has no position in the stocks mentioned.
We aim to bring you long-term focused research analysis driven by fundamental data. Note that our analysis may not factor in the latest price-sensitive company announcements or qualitative material. Thank you for reading.
About NYSE:KRO
Kronos Worldwide
Produces and markets titanium dioxide pigments (TiO2) in Europe, North America, the Asia Pacific, and internationally.
Slight with mediocre balance sheet.
Similar Companies
Market Insights

Advertisement
Community Narratives
Vita Life Sciences Set for a 12.72% Revenue Growth While Tackling Operational Challenges
Fair Value AU$2.42|8.7% undervalued
RO
Community Contributor
Vossloh rides a €500 billion wave to boost growth and earnings in the next decade
Fair Value €78.41|6.3% undervalued
CH
Community Contributor
Intuitive Surgical Will Transform Healthcare with 12% Revenue Growth
Fair Value US$325.55|56.5% overvalued
UN
Community Contributor