Stock Analysis
- Australia
- /
- Construction
- /
- ASX:WOR
Worley Limited's (ASX:WOR) Stock Been Rising But Financials Look Weak: Should Shareholders Be Worried?

Worley's (ASX:WOR) stock is up by 5.2% over the past three months. However, in this article, we decided to focus on its weak financials, as long-term fundamentals ultimately dictate market outcomes. Particularly, we will be paying attention to Worley's ROE today.
Return on equity or ROE is a key measure used to assess how efficiently a company's management is utilizing the company's capital. In short, ROE shows the profit each dollar generates with respect to its shareholder investments.
See our latest analysis for Worley
How To Calculate Return On Equity?
Return on equity can be calculated by using the formula:
Return on Equity = Net Profit (from continuing operations) ÷ Shareholders' Equity
So, based on the above formula, the ROE for Worley is:
4.6% = AU$251m ÷ AU$5.4b (Based on the trailing twelve months to December 2023).
The 'return' is the yearly profit. So, this means that for every A$1 of its shareholder's investments, the company generates a profit of A$0.05.
What Has ROE Got To Do With Earnings Growth?
Thus far, we have learned that ROE measures how efficiently a company is generating its profits. We now need to evaluate how much profit the company reinvests or "retains" for future growth which then gives us an idea about the growth potential of the company. Assuming all else is equal, companies that have both a higher return on equity and higher profit retention are usually the ones that have a higher growth rate when compared to companies that don't have the same features.
A Side By Side comparison of Worley's Earnings Growth And 4.6% ROE
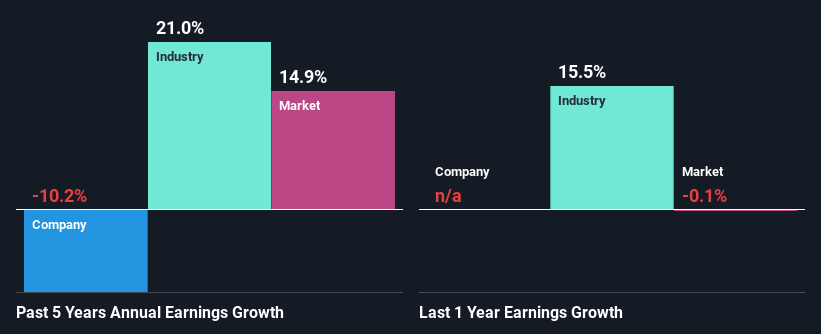
On the face of it, Worley's ROE is not much to talk about. Next, when compared to the average industry ROE of 12%, the company's ROE leaves us feeling even less enthusiastic. Given the circumstances, the significant decline in net income by 10% seen by Worley over the last five years is not surprising. We reckon that there could also be other factors at play here. Such as - low earnings retention or poor allocation of capital.
That being said, we compared Worley's performance with the industry and were concerned when we found that while the company has shrunk its earnings, the industry has grown its earnings at a rate of 21% in the same 5-year period.
Earnings growth is a huge factor in stock valuation. The investor should try to establish if the expected growth or decline in earnings, whichever the case may be, is priced in. Doing so will help them establish if the stock's future looks promising or ominous. Is WOR fairly valued? This infographic on the company's intrinsic value has everything you need to know.
Is Worley Efficiently Re-investing Its Profits?
Worley's very high three-year median payout ratio of 237% over the last three years suggests that the company is paying its shareholders more than what it is earning and this explains the company's shrinking earnings. Paying a dividend higher than reported profits is not a sustainable move.
In addition, Worley has been paying dividends over a period of at least ten years suggesting that keeping up dividend payments is way more important to the management even if it comes at the cost of business growth. Upon studying the latest analysts' consensus data, we found that the company's future payout ratio is expected to drop to 69% over the next three years. As a result, the expected drop in Worley's payout ratio explains the anticipated rise in the company's future ROE to 9.6%, over the same period.
Summary
On the whole, Worley's performance is quite a big let-down. The low ROE, combined with the fact that the company is paying out almost if not all, of its profits as dividends, has resulted in the lack or absence of growth in its earnings. Having said that, looking at current analyst estimates, we found that the company's earnings growth rate is expected to see a huge improvement. Are these analysts expectations based on the broad expectations for the industry, or on the company's fundamentals? Click here to be taken to our analyst's forecasts page for the company.
Valuation is complex, but we're helping make it simple.
Find out whether Worley is potentially over or undervalued by checking out our comprehensive analysis, which includes fair value estimates, risks and warnings, dividends, insider transactions and financial health.
View the Free AnalysisHave feedback on this article? Concerned about the content? Get in touch with us directly. Alternatively, email editorial-team (at) simplywallst.com.
This article by Simply Wall St is general in nature. We provide commentary based on historical data and analyst forecasts only using an unbiased methodology and our articles are not intended to be financial advice. It does not constitute a recommendation to buy or sell any stock, and does not take account of your objectives, or your financial situation. We aim to bring you long-term focused analysis driven by fundamental data. Note that our analysis may not factor in the latest price-sensitive company announcements or qualitative material. Simply Wall St has no position in any stocks mentioned.

Simply Wall St
About ASX:WOR
Worley
Worley Limited provides professional project and asset services to energy, chemicals, and resources sectors worldwide.
Excellent balance sheet with reasonable growth potential.
