Stock Analysis
Syncro Group AB (publ) (FRA:7PF) Soars 122% But It's A Story Of Risk Vs Reward

Despite an already strong run, Syncro Group AB (publ) (FRA:7PF) shares have been powering on, with a gain of 122% in the last thirty days. Unfortunately, the gains of the last month did little to right the losses of the last year with the stock still down 37% over that time.
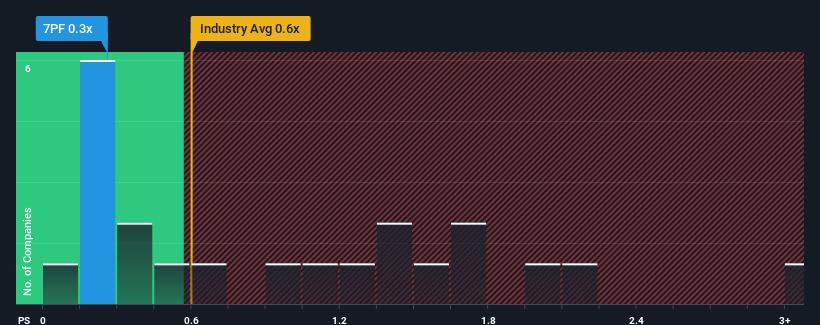
Even after such a large jump in price, it's still not a stretch to say that Syncro Group's price-to-sales (or "P/S") ratio of 0.3x right now seems quite "middle-of-the-road" compared to the Electronic industry in Germany, where the median P/S ratio is around 0.6x. While this might not raise any eyebrows, if the P/S ratio is not justified investors could be missing out on a potential opportunity or ignoring looming disappointment.
See our latest analysis for Syncro Group
What Does Syncro Group's Recent Performance Look Like?
For example, consider that Syncro Group's financial performance has been pretty ordinary lately as revenue growth is non-existent. Perhaps the market believes the recent run-of-the-mill revenue performance isn't enough to outperform the industry, which has kept the P/S muted. If you like the company, you'd be hoping this isn't the case so that you could potentially pick up some stock while it's not quite in favour.
Although there are no analyst estimates available for Syncro Group, take a look at this free data-rich visualisation to see how the company stacks up on earnings, revenue and cash flow.What Are Revenue Growth Metrics Telling Us About The P/S?
The only time you'd be comfortable seeing a P/S like Syncro Group's is when the company's growth is tracking the industry closely.
If we review the last year of revenue, the company posted a result that saw barely any deviation from a year ago. Despite the lack of growth, the company was still able to deliver immense revenue growth over the last three years. Therefore, it's fair to say the revenue growth recently has been superb for the company, but investors will want to ask why it has slowed to such an extent.
Comparing that recent medium-term revenue trajectory with the industry's one-year growth forecast of 46% shows it's noticeably more attractive.
With this information, we find it interesting that Syncro Group is trading at a fairly similar P/S compared to the industry. Apparently some shareholders believe the recent performance is at its limits and have been accepting lower selling prices.
The Key Takeaway
Syncro Group's stock has a lot of momentum behind it lately, which has brought its P/S level with the rest of the industry. Using the price-to-sales ratio alone to determine if you should sell your stock isn't sensible, however it can be a practical guide to the company's future prospects.
We've established that Syncro Group currently trades on a lower than expected P/S since its recent three-year growth is higher than the wider industry forecast. There could be some unobserved threats to revenue preventing the P/S ratio from matching this positive performance. It appears some are indeed anticipating revenue instability, because the persistence of these recent medium-term conditions would normally provide a boost to the share price.
Before you settle on your opinion, we've discovered 5 warning signs for Syncro Group that you should be aware of.
If strong companies turning a profit tickle your fancy, then you'll want to check out this free list of interesting companies that trade on a low P/E (but have proven they can grow earnings).
Valuation is complex, but we're helping make it simple.
Find out whether Syncro Group is potentially over or undervalued by checking out our comprehensive analysis, which includes fair value estimates, risks and warnings, dividends, insider transactions and financial health.
View the Free AnalysisHave feedback on this article? Concerned about the content? Get in touch with us directly. Alternatively, email editorial-team (at) simplywallst.com.
This article by Simply Wall St is general in nature. We provide commentary based on historical data and analyst forecasts only using an unbiased methodology and our articles are not intended to be financial advice. It does not constitute a recommendation to buy or sell any stock, and does not take account of your objectives, or your financial situation. We aim to bring you long-term focused analysis driven by fundamental data. Note that our analysis may not factor in the latest price-sensitive company announcements or qualitative material. Simply Wall St has no position in any stocks mentioned.

Simply Wall St
About DB:7PF
Syncro Group
Syncro Group AB (publ), through its subsidiaries, operates recruiting platform in Sweden and internationally.
Slightly overvalued with imperfect balance sheet.
