Stock Analysis


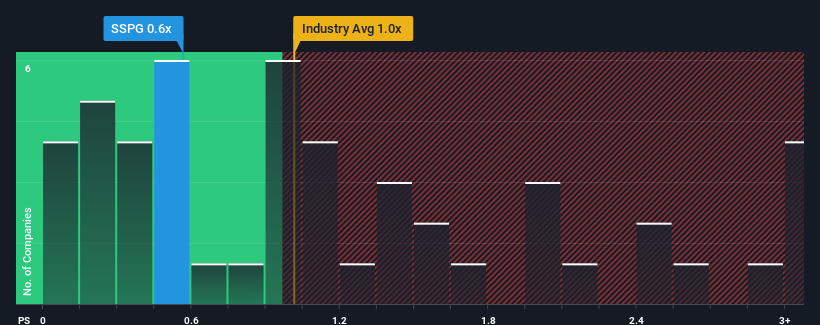
It's not a stretch to say that SSP Group plc's (LON:SSPG) price-to-sales (or "P/S") ratio of 0.6x right now seems quite "middle-of-the-road" for companies in the Hospitality industry in the United Kingdom, where the median P/S ratio is around 1x. However, investors might be overlooking a clear opportunity or potential setback if there is no rational basis for the P/S.
Check out our latest analysis for SSP Group
How Has SSP Group Performed Recently?
SSP Group certainly has been doing a good job lately as it's been growing revenue more than most other companies. It might be that many expect the strong revenue performance to wane, which has kept the P/S ratio from rising. If not, then existing shareholders have reason to be feeling optimistic about the future direction of the share price.
If you'd like to see what analysts are forecasting going forward, you should check out our free report on SSP Group.How Is SSP Group's Revenue Growth Trending?
The only time you'd be comfortable seeing a P/S like SSP Group's is when the company's growth is tracking the industry closely.
Taking a look back first, we see that the company grew revenue by an impressive 38% last year. Pleasingly, revenue has also lifted 110% in aggregate from three years ago, thanks to the last 12 months of growth. Therefore, it's fair to say the revenue growth recently has been superb for the company.
Turning to the outlook, the next three years should generate growth of 9.2% per annum as estimated by the analysts watching the company. With the industry predicted to deliver 8.7% growth each year, the company is positioned for a comparable revenue result.
With this in mind, it makes sense that SSP Group's P/S is closely matching its industry peers. It seems most investors are expecting to see average future growth and are only willing to pay a moderate amount for the stock.
What We Can Learn From SSP Group's P/S?
We'd say the price-to-sales ratio's power isn't primarily as a valuation instrument but rather to gauge current investor sentiment and future expectations.
Our look at SSP Group's revenue growth estimates show that its P/S is about what we expect, as both metrics follow closely with the industry averages. Right now shareholders are comfortable with the P/S as they are quite confident future revenue won't throw up any surprises. If all things remain constant, the possibility of a drastic share price movement remains fairly remote.
It is also worth noting that we have found 2 warning signs for SSP Group (1 is a bit concerning!) that you need to take into consideration.
If companies with solid past earnings growth is up your alley, you may wish to see this free collection of other companies with strong earnings growth and low P/E ratios.
Valuation is complex, but we're helping make it simple.
Find out whether SSP Group is potentially over or undervalued by checking out our comprehensive analysis, which includes fair value estimates, risks and warnings, dividends, insider transactions and financial health.
View the Free AnalysisHave feedback on this article? Concerned about the content? Get in touch with us directly. Alternatively, email editorial-team (at) simplywallst.com.
This article by Simply Wall St is general in nature. We provide commentary based on historical data and analyst forecasts only using an unbiased methodology and our articles are not intended to be financial advice. It does not constitute a recommendation to buy or sell any stock, and does not take account of your objectives, or your financial situation. We aim to bring you long-term focused analysis driven by fundamental data. Note that our analysis may not factor in the latest price-sensitive company announcements or qualitative material. Simply Wall St has no position in any stocks mentioned.
About LSE:SSPG
SSP Group
SSP Group plc operates food and beverage outlets in North America, Europe, the United Kingdom, Ireland, the Asia Pacific, Eastern Europe, the Middle East, and internationally.
High growth potential and good value.
