Returns On Capital At Tamilnadu Petroproducts (NSE:TNPETRO) Paint A Concerning Picture


If we want to find a stock that could multiply over the long term, what are the underlying trends we should look for? Firstly, we'd want to identify a growing return on capital employed (ROCE) and then alongside that, an ever-increasing base of capital employed. Ultimately, this demonstrates that it's a business that is reinvesting profits at increasing rates of return. Having said that, from a first glance at Tamilnadu Petroproducts (NSE:TNPETRO) we aren't jumping out of our chairs at how returns are trending, but let's have a deeper look.
What Is Return On Capital Employed (ROCE)?
Just to clarify if you're unsure, ROCE is a metric for evaluating how much pre-tax income (in percentage terms) a company earns on the capital invested in its business. To calculate this metric for Tamilnadu Petroproducts, this is the formula:
Return on Capital Employed = Earnings Before Interest and Tax (EBIT) ÷ (Total Assets - Current Liabilities)
0.052 = ₹494m ÷ (₹11b - ₹1.5b) (Based on the trailing twelve months to March 2024).
Thus, Tamilnadu Petroproducts has an ROCE of 5.2%. Ultimately, that's a low return and it under-performs the Chemicals industry average of 13%.
Check out our latest analysis for Tamilnadu Petroproducts
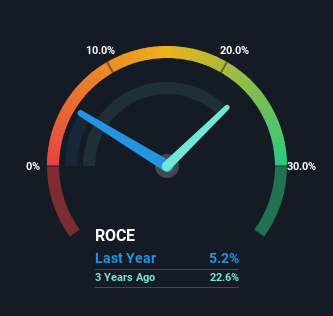
Historical performance is a great place to start when researching a stock so above you can see the gauge for Tamilnadu Petroproducts' ROCE against it's prior returns. If you want to delve into the historical earnings , check out these free graphs detailing revenue and cash flow performance of Tamilnadu Petroproducts.
The Trend Of ROCE
In terms of Tamilnadu Petroproducts' historical ROCE movements, the trend isn't fantastic. Around five years ago the returns on capital were 15%, but since then they've fallen to 5.2%. Given the business is employing more capital while revenue has slipped, this is a bit concerning. If this were to continue, you might be looking at a company that is trying to reinvest for growth but is actually losing market share since sales haven't increased.
On a side note, Tamilnadu Petroproducts has done well to pay down its current liabilities to 14% of total assets. So we could link some of this to the decrease in ROCE. What's more, this can reduce some aspects of risk to the business because now the company's suppliers or short-term creditors are funding less of its operations. Some would claim this reduces the business' efficiency at generating ROCE since it is now funding more of the operations with its own money.
The Bottom Line On Tamilnadu Petroproducts' ROCE
In summary, we're somewhat concerned by Tamilnadu Petroproducts' diminishing returns on increasing amounts of capital. Since the stock has skyrocketed 262% over the last five years, it looks like investors have high expectations of the stock. In any case, the current underlying trends don't bode well for long term performance so unless they reverse, we'd start looking elsewhere.
Tamilnadu Petroproducts does have some risks though, and we've spotted 2 warning signs for Tamilnadu Petroproducts that you might be interested in.
While Tamilnadu Petroproducts isn't earning the highest return, check out this free list of companies that are earning high returns on equity with solid balance sheets.
Valuation is complex, but we're here to simplify it.
Discover if Tamilnadu Petroproducts might be undervalued or overvalued with our detailed analysis, featuring fair value estimates, potential risks, dividends, insider trades, and its financial condition.
Access Free AnalysisHave feedback on this article? Concerned about the content? Get in touch with us directly. Alternatively, email editorial-team (at) simplywallst.com.
This article by Simply Wall St is general in nature. We provide commentary based on historical data and analyst forecasts only using an unbiased methodology and our articles are not intended to be financial advice. It does not constitute a recommendation to buy or sell any stock, and does not take account of your objectives, or your financial situation. We aim to bring you long-term focused analysis driven by fundamental data. Note that our analysis may not factor in the latest price-sensitive company announcements or qualitative material. Simply Wall St has no position in any stocks mentioned.
Have feedback on this article? Concerned about the content? Get in touch with us directly. Alternatively, email editorial-team@simplywallst.com
About NSEI:TNPETRO
Tamilnadu Petroproducts
Manufactures and sells petrochemical and industrial intermediate chemical products in India.
Flawless balance sheet, good value and pays a dividend.

