Stock Analysis
- United Kingdom
- /
- Media
- /
- AIM:NFG
Next 15 Group (LON:NFG) stock performs better than its underlying earnings growth over last five years


Generally speaking the aim of active stock picking is to find companies that provide returns that are superior to the market average. Buying under-rated businesses is one path to excess returns. For example, long term Next 15 Group plc (LON:NFG) shareholders have enjoyed a 79% share price rise over the last half decade, well in excess of the market return of around 0.6% (not including dividends). On the other hand, the more recent gains haven't been so impressive, with shareholders gaining just 20% , including dividends .
The past week has proven to be lucrative for Next 15 Group investors, so let's see if fundamentals drove the company's five-year performance.
View our latest analysis for Next 15 Group
To paraphrase Benjamin Graham: Over the short term the market is a voting machine, but over the long term it's a weighing machine. One flawed but reasonable way to assess how sentiment around a company has changed is to compare the earnings per share (EPS) with the share price.
During the five years of share price growth, Next 15 Group moved from a loss to profitability. That would generally be considered a positive, so we'd hope to see the share price to rise.
The company's earnings per share (over time) is depicted in the image below (click to see the exact numbers).
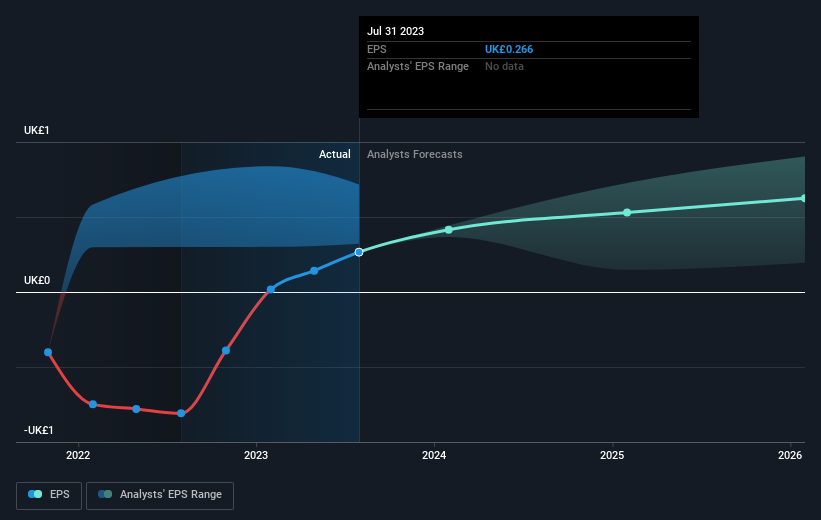
We know that Next 15 Group has improved its bottom line lately, but is it going to grow revenue? This free report showing analyst revenue forecasts should help you figure out if the EPS growth can be sustained.
What About Dividends?
It is important to consider the total shareholder return, as well as the share price return, for any given stock. The TSR incorporates the value of any spin-offs or discounted capital raisings, along with any dividends, based on the assumption that the dividends are reinvested. Arguably, the TSR gives a more comprehensive picture of the return generated by a stock. In the case of Next 15 Group, it has a TSR of 90% for the last 5 years. That exceeds its share price return that we previously mentioned. And there's no prize for guessing that the dividend payments largely explain the divergence!
A Different Perspective
We're pleased to report that Next 15 Group shareholders have received a total shareholder return of 20% over one year. Of course, that includes the dividend. Since the one-year TSR is better than the five-year TSR (the latter coming in at 14% per year), it would seem that the stock's performance has improved in recent times. Someone with an optimistic perspective could view the recent improvement in TSR as indicating that the business itself is getting better with time. Is Next 15 Group cheap compared to other companies? These 3 valuation measures might help you decide.
Of course Next 15 Group may not be the best stock to buy. So you may wish to see this free collection of growth stocks.
Please note, the market returns quoted in this article reflect the market weighted average returns of stocks that currently trade on British exchanges.
Valuation is complex, but we're helping make it simple.
Find out whether Next 15 Group is potentially over or undervalued by checking out our comprehensive analysis, which includes fair value estimates, risks and warnings, dividends, insider transactions and financial health.
View the Free AnalysisHave feedback on this article? Concerned about the content? Get in touch with us directly. Alternatively, email editorial-team (at) simplywallst.com.
This article by Simply Wall St is general in nature. We provide commentary based on historical data and analyst forecasts only using an unbiased methodology and our articles are not intended to be financial advice. It does not constitute a recommendation to buy or sell any stock, and does not take account of your objectives, or your financial situation. We aim to bring you long-term focused analysis driven by fundamental data. Note that our analysis may not factor in the latest price-sensitive company announcements or qualitative material. Simply Wall St has no position in any stocks mentioned.
About AIM:NFG
Next 15 Group
Next 15 Group plc, together with its subsidiaries, provides communications services in the United Kingdom, Europe, Africa, the United States, and the Asia Pacific.
Undervalued with solid track record.
