Stock Analysis
- Canada
- /
- Oil and Gas
- /
- TSX:CPG
Is There An Opportunity With Crescent Point Energy Corp.'s (TSE:CPG) 42% Undervaluation?

Key Insights
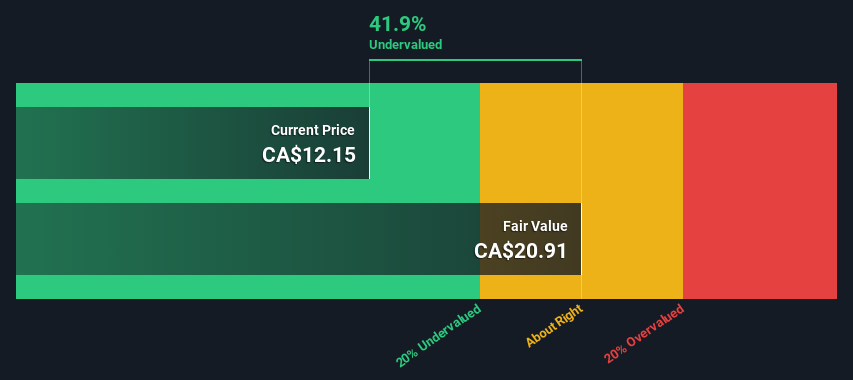
- Crescent Point Energy's estimated fair value is CA$20.91 based on 2 Stage Free Cash Flow to Equity
- Crescent Point Energy's CA$12.15 share price signals that it might be 42% undervalued
- The CA$13.21 analyst price target for CPG is 37% less than our estimate of fair value
Today we'll do a simple run through of a valuation method used to estimate the attractiveness of Crescent Point Energy Corp. (TSE:CPG) as an investment opportunity by taking the expected future cash flows and discounting them to today's value. One way to achieve this is by employing the Discounted Cash Flow (DCF) model. It may sound complicated, but actually it is quite simple!
Remember though, that there are many ways to estimate a company's value, and a DCF is just one method. If you want to learn more about discounted cash flow, the rationale behind this calculation can be read in detail in the Simply Wall St analysis model.
Check out our latest analysis for Crescent Point Energy
Step By Step Through The Calculation
We use what is known as a 2-stage model, which simply means we have two different periods of growth rates for the company's cash flows. Generally the first stage is higher growth, and the second stage is a lower growth phase. To begin with, we have to get estimates of the next ten years of cash flows. Where possible we use analyst estimates, but when these aren't available we extrapolate the previous free cash flow (FCF) from the last estimate or reported value. We assume companies with shrinking free cash flow will slow their rate of shrinkage, and that companies with growing free cash flow will see their growth rate slow, over this period. We do this to reflect that growth tends to slow more in the early years than it does in later years.
Generally we assume that a dollar today is more valuable than a dollar in the future, so we discount the value of these future cash flows to their estimated value in today's dollars:
10-year free cash flow (FCF) estimate
| 2024 | 2025 | 2026 | 2027 | 2028 | 2029 | 2030 | 2031 | 2032 | 2033 | |
| Levered FCF (CA$, Millions) | CA$871.3m | CA$1.06b | CA$818.3m | CA$1.03b | CA$937.7m | CA$933.5m | CA$936.1m | CA$943.6m | CA$954.5m | CA$967.9m |
| Growth Rate Estimate Source | Analyst x8 | Analyst x8 | Analyst x3 | Analyst x2 | Analyst x3 | Est @ -0.45% | Est @ 0.28% | Est @ 0.80% | Est @ 1.15% | Est @ 1.41% |
| Present Value (CA$, Millions) Discounted @ 8.5% | CA$803 | CA$897 | CA$641 | CA$743 | CA$625 | CA$573 | CA$530 | CA$492 | CA$459 | CA$429 |
("Est" = FCF growth rate estimated by Simply Wall St)
Present Value of 10-year Cash Flow (PVCF) = CA$6.2b
After calculating the present value of future cash flows in the initial 10-year period, we need to calculate the Terminal Value, which accounts for all future cash flows beyond the first stage. The Gordon Growth formula is used to calculate Terminal Value at a future annual growth rate equal to the 5-year average of the 10-year government bond yield of 2.0%. We discount the terminal cash flows to today's value at a cost of equity of 8.5%.
Terminal Value (TV)= FCF2033 × (1 + g) ÷ (r – g) = CA$968m× (1 + 2.0%) ÷ (8.5%– 2.0%) = CA$15b
Present Value of Terminal Value (PVTV)= TV / (1 + r)10= CA$15b÷ ( 1 + 8.5%)10= CA$6.8b
The total value, or equity value, is then the sum of the present value of the future cash flows, which in this case is CA$13b. The last step is to then divide the equity value by the number of shares outstanding. Compared to the current share price of CA$12.2, the company appears quite good value at a 42% discount to where the stock price trades currently. The assumptions in any calculation have a big impact on the valuation, so it is better to view this as a rough estimate, not precise down to the last cent.
Important Assumptions
The calculation above is very dependent on two assumptions. The first is the discount rate and the other is the cash flows. Part of investing is coming up with your own evaluation of a company's future performance, so try the calculation yourself and check your own assumptions. The DCF also does not consider the possible cyclicality of an industry, or a company's future capital requirements, so it does not give a full picture of a company's potential performance. Given that we are looking at Crescent Point Energy as potential shareholders, the cost of equity is used as the discount rate, rather than the cost of capital (or weighted average cost of capital, WACC) which accounts for debt. In this calculation we've used 8.5%, which is based on a levered beta of 1.408. Beta is a measure of a stock's volatility, compared to the market as a whole. We get our beta from the industry average beta of globally comparable companies, with an imposed limit between 0.8 and 2.0, which is a reasonable range for a stable business.
SWOT Analysis for Crescent Point Energy
- Debt is well covered by earnings and cashflows.
- Dividends are covered by earnings and cash flows.
- Earnings declined over the past year.
- Dividend is low compared to the top 25% of dividend payers in the Oil and Gas market.
- Shareholders have been diluted in the past year.
- Annual revenue is forecast to grow faster than the Canadian market.
- Trading below our estimate of fair value by more than 20%.
- Significant insider buying over the past 3 months.
- Annual earnings are forecast to decline for the next 3 years.
Moving On:
Valuation is only one side of the coin in terms of building your investment thesis, and it is only one of many factors that you need to assess for a company. DCF models are not the be-all and end-all of investment valuation. Rather it should be seen as a guide to "what assumptions need to be true for this stock to be under/overvalued?" For instance, if the terminal value growth rate is adjusted slightly, it can dramatically alter the overall result. What is the reason for the share price sitting below the intrinsic value? For Crescent Point Energy, we've put together three additional aspects you should further research:
- Risks: Be aware that Crescent Point Energy is showing 4 warning signs in our investment analysis , and 1 of those can't be ignored...
- Future Earnings: How does CPG's growth rate compare to its peers and the wider market? Dig deeper into the analyst consensus number for the upcoming years by interacting with our free analyst growth expectation chart.
- Other Solid Businesses: Low debt, high returns on equity and good past performance are fundamental to a strong business. Why not explore our interactive list of stocks with solid business fundamentals to see if there are other companies you may not have considered!
PS. The Simply Wall St app conducts a discounted cash flow valuation for every stock on the TSX every day. If you want to find the calculation for other stocks just search here.
Valuation is complex, but we're helping make it simple.
Find out whether Crescent Point Energy is potentially over or undervalued by checking out our comprehensive analysis, which includes fair value estimates, risks and warnings, dividends, insider transactions and financial health.
View the Free AnalysisHave feedback on this article? Concerned about the content? Get in touch with us directly. Alternatively, email editorial-team (at) simplywallst.com.
This article by Simply Wall St is general in nature. We provide commentary based on historical data and analyst forecasts only using an unbiased methodology and our articles are not intended to be financial advice. It does not constitute a recommendation to buy or sell any stock, and does not take account of your objectives, or your financial situation. We aim to bring you long-term focused analysis driven by fundamental data. Note that our analysis may not factor in the latest price-sensitive company announcements or qualitative material. Simply Wall St has no position in any stocks mentioned.
About TSX:CPG
Crescent Point Energy
Crescent Point Energy Corp. explores, develops, and produces oil and gas properties in Canada and the United States.
Fair value with mediocre balance sheet.
