Stock Analysis
- Canada
- /
- Metals and Mining
- /
- TSXV:RBX
Is Robex Resources Inc.'s (CVE:RBX) Stock's Recent Performance Being Led By Its Attractive Financial Prospects?


Most readers would already be aware that Robex Resources' (CVE:RBX) stock increased significantly by 28% over the past month. Given the company's impressive performance, we decided to study its financial indicators more closely as a company's financial health over the long-term usually dictates market outcomes. Particularly, we will be paying attention to Robex Resources' ROE today.
ROE or return on equity is a useful tool to assess how effectively a company can generate returns on the investment it received from its shareholders. In short, ROE shows the profit each dollar generates with respect to its shareholder investments.
View our latest analysis for Robex Resources
How Is ROE Calculated?
The formula for return on equity is:
Return on Equity = Net Profit (from continuing operations) ÷ Shareholders' Equity
So, based on the above formula, the ROE for Robex Resources is:
11% = CA$23m ÷ CA$214m (Based on the trailing twelve months to September 2023).
The 'return' is the profit over the last twelve months. One way to conceptualize this is that for each CA$1 of shareholders' capital it has, the company made CA$0.11 in profit.
What Has ROE Got To Do With Earnings Growth?
So far, we've learned that ROE is a measure of a company's profitability. Depending on how much of these profits the company reinvests or "retains", and how effectively it does so, we are then able to assess a company’s earnings growth potential. Assuming all else is equal, companies that have both a higher return on equity and higher profit retention are usually the ones that have a higher growth rate when compared to companies that don't have the same features.
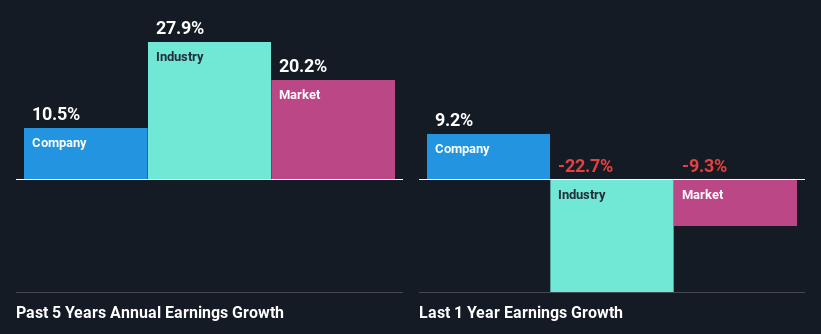
Robex Resources' Earnings Growth And 11% ROE
To start with, Robex Resources' ROE looks acceptable. And on comparing with the industry, we found that the the average industry ROE is similar at 9.0%. This probably goes some way in explaining Robex Resources' moderate 11% growth over the past five years amongst other factors.
Next, on comparing with the industry net income growth, we found that Robex Resources' reported growth was lower than the industry growth of 28% over the last few years, which is not something we like to see.
The basis for attaching value to a company is, to a great extent, tied to its earnings growth. It’s important for an investor to know whether the market has priced in the company's expected earnings growth (or decline). By doing so, they will have an idea if the stock is headed into clear blue waters or if swampy waters await. If you're wondering about Robex Resources''s valuation, check out this gauge of its price-to-earnings ratio, as compared to its industry.
Is Robex Resources Using Its Retained Earnings Effectively?
Robex Resources doesn't pay any regular dividends currently which essentially means that it has been reinvesting all of its profits into the business. This definitely contributes to the decent earnings growth number that we discussed above.
Conclusion
In total, we are pretty happy with Robex Resources' performance. In particular, it's great to see that the company is investing heavily into its business and along with a high rate of return, that has resulted in a respectable growth in its earnings. If the company continues to grow its earnings the way it has, that could have a positive impact on its share price given how earnings per share influence long-term share prices. Not to forget, share price outcomes are also dependent on the potential risks a company may face. So it is important for investors to be aware of the risks involved in the business. You can see the 1 risk we have identified for Robex Resources by visiting our risks dashboard for free on our platform here.
Valuation is complex, but we're helping make it simple.
Find out whether Robex Resources is potentially over or undervalued by checking out our comprehensive analysis, which includes fair value estimates, risks and warnings, dividends, insider transactions and financial health.
View the Free AnalysisHave feedback on this article? Concerned about the content? Get in touch with us directly. Alternatively, email editorial-team (at) simplywallst.com.
This article by Simply Wall St is general in nature. We provide commentary based on historical data and analyst forecasts only using an unbiased methodology and our articles are not intended to be financial advice. It does not constitute a recommendation to buy or sell any stock, and does not take account of your objectives, or your financial situation. We aim to bring you long-term focused analysis driven by fundamental data. Note that our analysis may not factor in the latest price-sensitive company announcements or qualitative material. Simply Wall St has no position in any stocks mentioned.
About TSXV:RBX
Robex Resources
Robex Resources Inc. operates as a gold production and development company in West Africa.
Excellent balance sheet with proven track record.
