Stock Analysis
- Spain
- /
- Hospitality
- /
- BME:AMS
Investors in Amadeus IT Group (BME:AMS) have unfortunately lost 13% over the last five years

Ideally, your overall portfolio should beat the market average. But every investor is virtually certain to have both over-performing and under-performing stocks. At this point some shareholders may be questioning their investment in Amadeus IT Group, S.A. (BME:AMS), since the last five years saw the share price fall 16%. The falls have accelerated recently, with the share price down 10% in the last three months.
With that in mind, it's worth seeing if the company's underlying fundamentals have been the driver of long term performance, or if there are some discrepancies.
Check out our latest analysis for Amadeus IT Group
There is no denying that markets are sometimes efficient, but prices do not always reflect underlying business performance. By comparing earnings per share (EPS) and share price changes over time, we can get a feel for how investor attitudes to a company have morphed over time.
Amadeus IT Group became profitable within the last five years. Most would consider that to be a good thing, so it's counter-intuitive to see the share price declining. Other metrics might give us a better handle on how its value is changing over time.
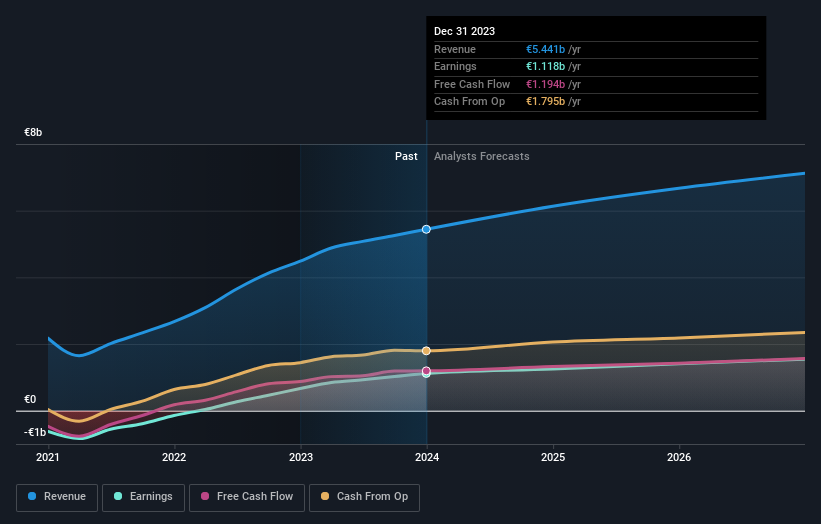
The revenue fall of 1.4% per year for five years is neither good nor terrible. But if the market expected durable top line growth, then that could explain the share price weakness.
You can see how earnings and revenue have changed over time in the image below (click on the chart to see the exact values).
Amadeus IT Group is a well known stock, with plenty of analyst coverage, suggesting some visibility into future growth. So we recommend checking out this free report showing consensus forecasts
What About Dividends?
It is important to consider the total shareholder return, as well as the share price return, for any given stock. The TSR is a return calculation that accounts for the value of cash dividends (assuming that any dividend received was reinvested) and the calculated value of any discounted capital raisings and spin-offs. So for companies that pay a generous dividend, the TSR is often a lot higher than the share price return. As it happens, Amadeus IT Group's TSR for the last 5 years was -13%, which exceeds the share price return mentioned earlier. The dividends paid by the company have thusly boosted the total shareholder return.
A Different Perspective
While the broader market gained around 15% in the last year, Amadeus IT Group shareholders lost 3.6% (even including dividends). However, keep in mind that even the best stocks will sometimes underperform the market over a twelve month period. Unfortunately, last year's performance may indicate unresolved challenges, given that it was worse than the annualised loss of 3% over the last half decade. Generally speaking long term share price weakness can be a bad sign, though contrarian investors might want to research the stock in hope of a turnaround. I find it very interesting to look at share price over the long term as a proxy for business performance. But to truly gain insight, we need to consider other information, too. Case in point: We've spotted 2 warning signs for Amadeus IT Group you should be aware of.
Of course, you might find a fantastic investment by looking elsewhere. So take a peek at this free list of companies we expect will grow earnings.
Please note, the market returns quoted in this article reflect the market weighted average returns of stocks that currently trade on Spanish exchanges.
Valuation is complex, but we're helping make it simple.
Find out whether Amadeus IT Group is potentially over or undervalued by checking out our comprehensive analysis, which includes fair value estimates, risks and warnings, dividends, insider transactions and financial health.
View the Free AnalysisHave feedback on this article? Concerned about the content? Get in touch with us directly. Alternatively, email editorial-team (at) simplywallst.com.
This article by Simply Wall St is general in nature. We provide commentary based on historical data and analyst forecasts only using an unbiased methodology and our articles are not intended to be financial advice. It does not constitute a recommendation to buy or sell any stock, and does not take account of your objectives, or your financial situation. We aim to bring you long-term focused analysis driven by fundamental data. Note that our analysis may not factor in the latest price-sensitive company announcements or qualitative material. Simply Wall St has no position in any stocks mentioned.

Simply Wall St
About BME:AMS
Amadeus IT Group
Amadeus IT Group, S.A., together with its subsidiaries, operates as a transaction processor for the travel and tourism industry worldwide.
Solid track record with reasonable growth potential and pays a dividend.
