Stock Analysis
- France
- /
- Renewable Energy
- /
- ENXTPA:NEOEN
Here's Why Neoen (EPA:NEOEN) Has A Meaningful Debt Burden

Warren Buffett famously said, 'Volatility is far from synonymous with risk.' It's only natural to consider a company's balance sheet when you examine how risky it is, since debt is often involved when a business collapses. We can see that Neoen S.A. (EPA:NEOEN) does use debt in its business. But is this debt a concern to shareholders?
When Is Debt A Problem?
Debt assists a business until the business has trouble paying it off, either with new capital or with free cash flow. Part and parcel of capitalism is the process of 'creative destruction' where failed businesses are mercilessly liquidated by their bankers. However, a more common (but still painful) scenario is that it has to raise new equity capital at a low price, thus permanently diluting shareholders. Of course, plenty of companies use debt to fund growth, without any negative consequences. When we examine debt levels, we first consider both cash and debt levels, together.
See our latest analysis for Neoen
What Is Neoen's Net Debt?
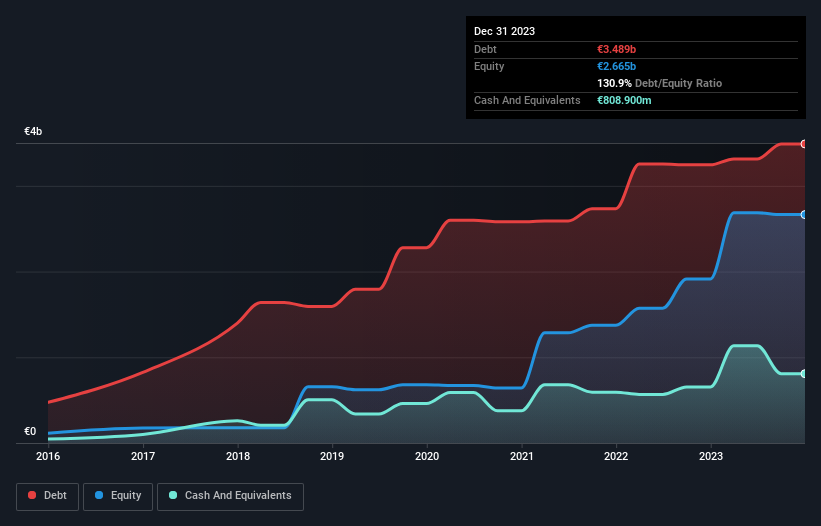
As you can see below, at the end of December 2023, Neoen had €3.49b of debt, up from €3.24b a year ago. Click the image for more detail. However, because it has a cash reserve of €808.9m, its net debt is less, at about €2.68b.
How Strong Is Neoen's Balance Sheet?
According to the last reported balance sheet, Neoen had liabilities of €877.4m due within 12 months, and liabilities of €3.86b due beyond 12 months. Offsetting this, it had €808.9m in cash and €223.0m in receivables that were due within 12 months. So its liabilities total €3.71b more than the combination of its cash and short-term receivables.
This is a mountain of leverage relative to its market capitalization of €4.36b. This suggests shareholders would be heavily diluted if the company needed to shore up its balance sheet in a hurry.
In order to size up a company's debt relative to its earnings, we calculate its net debt divided by its earnings before interest, tax, depreciation, and amortization (EBITDA) and its earnings before interest and tax (EBIT) divided by its interest expense (its interest cover). Thus we consider debt relative to earnings both with and without depreciation and amortization expenses.
While Neoen's debt to EBITDA ratio (4.9) suggests that it uses some debt, its interest cover is very weak, at 2.1, suggesting high leverage. So shareholders should probably be aware that interest expenses appear to have really impacted the business lately. Looking on the bright side, Neoen boosted its EBIT by a silky 47% in the last year. Like the milk of human kindness that sort of growth increases resilience, making the company more capable of managing debt. When analysing debt levels, the balance sheet is the obvious place to start. But ultimately the future profitability of the business will decide if Neoen can strengthen its balance sheet over time. So if you want to see what the professionals think, you might find this free report on analyst profit forecasts to be interesting.
Finally, a business needs free cash flow to pay off debt; accounting profits just don't cut it. So the logical step is to look at the proportion of that EBIT that is matched by actual free cash flow. During the last three years, Neoen burned a lot of cash. While that may be a result of expenditure for growth, it does make the debt far more risky.
Our View
To be frank both Neoen's interest cover and its track record of converting EBIT to free cash flow make us rather uncomfortable with its debt levels. But at least it's pretty decent at growing its EBIT; that's encouraging. Looking at the bigger picture, it seems clear to us that Neoen's use of debt is creating risks for the company. If everything goes well that may pay off but the downside of this debt is a greater risk of permanent losses. There's no doubt that we learn most about debt from the balance sheet. However, not all investment risk resides within the balance sheet - far from it. For example - Neoen has 1 warning sign we think you should be aware of.
If you're interested in investing in businesses that can grow profits without the burden of debt, then check out this free list of growing businesses that have net cash on the balance sheet.
Valuation is complex, but we're helping make it simple.
Find out whether Neoen is potentially over or undervalued by checking out our comprehensive analysis, which includes fair value estimates, risks and warnings, dividends, insider transactions and financial health.
View the Free AnalysisHave feedback on this article? Concerned about the content? Get in touch with us directly. Alternatively, email editorial-team (at) simplywallst.com.
This article by Simply Wall St is general in nature. We provide commentary based on historical data and analyst forecasts only using an unbiased methodology and our articles are not intended to be financial advice. It does not constitute a recommendation to buy or sell any stock, and does not take account of your objectives, or your financial situation. We aim to bring you long-term focused analysis driven by fundamental data. Note that our analysis may not factor in the latest price-sensitive company announcements or qualitative material. Simply Wall St has no position in any stocks mentioned.

Simply Wall St
About ENXTPA:NEOEN
Neoen
Neoen S.A., an independent renewable energy production company, engages in the development and operation of renewable energy power plants.
Solid track record with limited growth.
