Stock Analysis
Earnings Tell The Story For UCB SA (EBR:UCB) As Its Stock Soars 26%


Despite an already strong run, UCB SA (EBR:UCB) shares have been powering on, with a gain of 26% in the last thirty days. Looking back a bit further, it's encouraging to see the stock is up 35% in the last year.
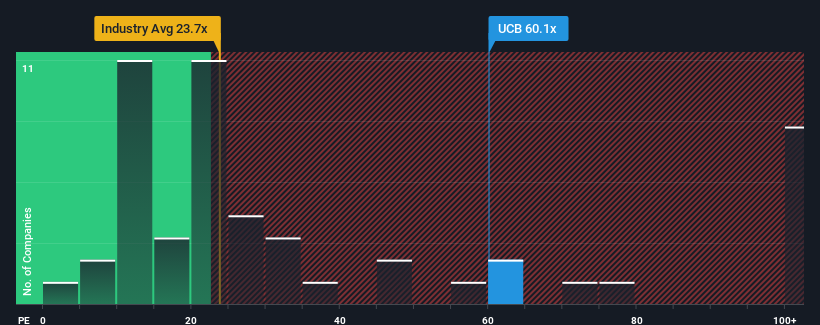
Since its price has surged higher, UCB's price-to-earnings (or "P/E") ratio of 60.1x might make it look like a strong sell right now compared to the market in Belgium, where around half of the companies have P/E ratios below 13x and even P/E's below 8x are quite common. However, the P/E might be quite high for a reason and it requires further investigation to determine if it's justified.
With earnings that are retreating more than the market's of late, UCB has been very sluggish. It might be that many expect the dismal earnings performance to recover substantially, which has kept the P/E from collapsing. If not, then existing shareholders may be very nervous about the viability of the share price.
View our latest analysis for UCB
What Are Growth Metrics Telling Us About The High P/E?
The only time you'd be truly comfortable seeing a P/E as steep as UCB's is when the company's growth is on track to outshine the market decidedly.
If we review the last year of earnings, dishearteningly the company's profits fell to the tune of 18%. This means it has also seen a slide in earnings over the longer-term as EPS is down 53% in total over the last three years. So unfortunately, we have to acknowledge that the company has not done a great job of growing earnings over that time.
Turning to the outlook, the next three years should generate growth of 45% per year as estimated by the analysts watching the company. Meanwhile, the rest of the market is forecast to only expand by 12% per annum, which is noticeably less attractive.
With this information, we can see why UCB is trading at such a high P/E compared to the market. It seems most investors are expecting this strong future growth and are willing to pay more for the stock.
The Bottom Line On UCB's P/E
UCB's P/E is flying high just like its stock has during the last month. It's argued the price-to-earnings ratio is an inferior measure of value within certain industries, but it can be a powerful business sentiment indicator.
As we suspected, our examination of UCB's analyst forecasts revealed that its superior earnings outlook is contributing to its high P/E. At this stage investors feel the potential for a deterioration in earnings isn't great enough to justify a lower P/E ratio. Unless these conditions change, they will continue to provide strong support to the share price.
Many other vital risk factors can be found on the company's balance sheet. Take a look at our free balance sheet analysis for UCB with six simple checks on some of these key factors.
Of course, you might also be able to find a better stock than UCB. So you may wish to see this free collection of other companies that have reasonable P/E ratios and have grown earnings strongly.
Valuation is complex, but we're helping make it simple.
Find out whether UCB is potentially over or undervalued by checking out our comprehensive analysis, which includes fair value estimates, risks and warnings, dividends, insider transactions and financial health.
View the Free AnalysisHave feedback on this article? Concerned about the content? Get in touch with us directly. Alternatively, email editorial-team (at) simplywallst.com.
This article by Simply Wall St is general in nature. We provide commentary based on historical data and analyst forecasts only using an unbiased methodology and our articles are not intended to be financial advice. It does not constitute a recommendation to buy or sell any stock, and does not take account of your objectives, or your financial situation. We aim to bring you long-term focused analysis driven by fundamental data. Note that our analysis may not factor in the latest price-sensitive company announcements or qualitative material. Simply Wall St has no position in any stocks mentioned.
About ENXTBR:UCB
UCB
UCB SA, a biopharmaceutical company, develops products and solutions for people with neurology and immunology diseases worldwide.
Reasonable growth potential with adequate balance sheet.
