Stock Analysis
- Mexico
- /
- Food and Staples Retail
- /
- BMV:LACOMER UBC
Declining Stock and Decent Financials: Is The Market Wrong About La Comer, S.A.B. de C.V. (BMV:LACOMERUBC)?


With its stock down 8.6% over the past three months, it is easy to disregard La Comer. de (BMV:LACOMERUBC). However, the company's fundamentals look pretty decent, and long-term financials are usually aligned with future market price movements. Particularly, we will be paying attention to La Comer. de's ROE today.
Return on equity or ROE is an important factor to be considered by a shareholder because it tells them how effectively their capital is being reinvested. Simply put, it is used to assess the profitability of a company in relation to its equity capital.
View our latest analysis for La Comer. de
How To Calculate Return On Equity?
ROE can be calculated by using the formula:
Return on Equity = Net Profit (from continuing operations) ÷ Shareholders' Equity
So, based on the above formula, the ROE for La Comer. de is:
7.3% = Mex$2.1b ÷ Mex$29b (Based on the trailing twelve months to December 2023).
The 'return' is the profit over the last twelve months. So, this means that for every MX$1 of its shareholder's investments, the company generates a profit of MX$0.07.
Why Is ROE Important For Earnings Growth?
So far, we've learned that ROE is a measure of a company's profitability. Based on how much of its profits the company chooses to reinvest or "retain", we are then able to evaluate a company's future ability to generate profits. Assuming everything else remains unchanged, the higher the ROE and profit retention, the higher the growth rate of a company compared to companies that don't necessarily bear these characteristics.
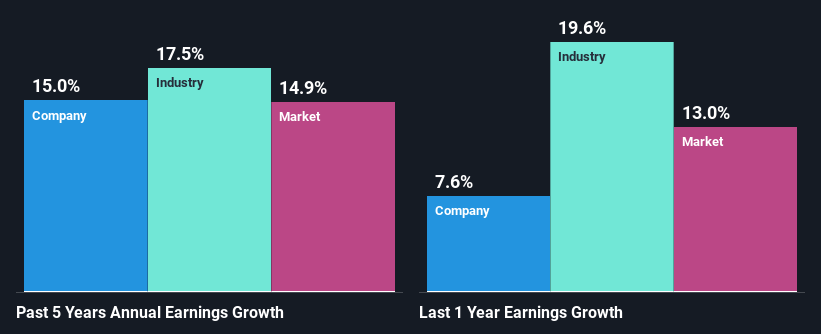
A Side By Side comparison of La Comer. de's Earnings Growth And 7.3% ROE
It is quite clear that La Comer. de's ROE is rather low. Even when compared to the industry average of 18%, the ROE figure is pretty disappointing. However, the moderate 15% net income growth seen by La Comer. de over the past five years is definitely a positive. Therefore, the growth in earnings could probably have been caused by other variables. Such as - high earnings retention or an efficient management in place.
As a next step, we compared La Comer. de's net income growth with the industry and found that the company has a similar growth figure when compared with the industry average growth rate of 18% in the same period.
The basis for attaching value to a company is, to a great extent, tied to its earnings growth. It’s important for an investor to know whether the market has priced in the company's expected earnings growth (or decline). By doing so, they will have an idea if the stock is headed into clear blue waters or if swampy waters await. If you're wondering about La Comer. de's's valuation, check out this gauge of its price-to-earnings ratio, as compared to its industry.
Is La Comer. de Efficiently Re-investing Its Profits?
La Comer. de's three-year median payout ratio to shareholders is 13% (implying that it retains 87% of its income), which is on the lower side, so it seems like the management is reinvesting profits heavily to grow its business.
Additionally, La Comer. de has paid dividends over a period of four years which means that the company is pretty serious about sharing its profits with shareholders. Existing analyst estimates suggest that the company's future payout ratio is expected to drop to 8.6% over the next three years. Despite the lower expected payout ratio, the company's ROE is not expected to change by much.
Summary
Overall, we feel that La Comer. de certainly does have some positive factors to consider. Despite its low rate of return, the fact that the company reinvests a very high portion of its profits into its business, no doubt contributed to its high earnings growth. The latest industry analyst forecasts show that the company is expected to maintain its current growth rate. Are these analysts expectations based on the broad expectations for the industry, or on the company's fundamentals? Click here to be taken to our analyst's forecasts page for the company.
Valuation is complex, but we're helping make it simple.
Find out whether La Comer. de is potentially over or undervalued by checking out our comprehensive analysis, which includes fair value estimates, risks and warnings, dividends, insider transactions and financial health.
View the Free AnalysisHave feedback on this article? Concerned about the content? Get in touch with us directly. Alternatively, email editorial-team (at) simplywallst.com.
This article by Simply Wall St is general in nature. We provide commentary based on historical data and analyst forecasts only using an unbiased methodology and our articles are not intended to be financial advice. It does not constitute a recommendation to buy or sell any stock, and does not take account of your objectives, or your financial situation. We aim to bring you long-term focused analysis driven by fundamental data. Note that our analysis may not factor in the latest price-sensitive company announcements or qualitative material. Simply Wall St has no position in any stocks mentioned.
About BMV:LACOMER UBC
La Comer. de
La Comer, S.A.B. de C.V., together with its subsidiaries, operates a chain of self-service stores in Mexico.
Flawless balance sheet with moderate growth potential.
