Stock Analysis


Key Insights
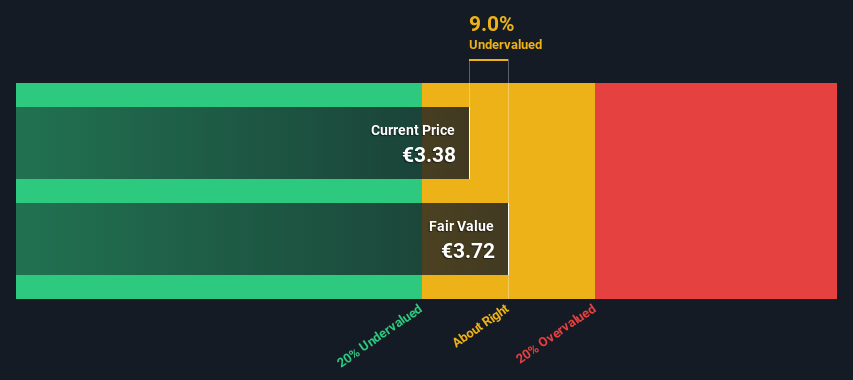
- Edil San Felice's estimated fair value is €3.72 based on 2 Stage Free Cash Flow to Equity
- Current share price of €3.38 suggests Edil San Felice is potentially trading close to its fair value
- The average premium for Edil San Felice's competitorsis currently 42%
How far off is Edil San Felice S.p.A. (BIT:ESF) from its intrinsic value? Using the most recent financial data, we'll take a look at whether the stock is fairly priced by taking the forecast future cash flows of the company and discounting them back to today's value. We will use the Discounted Cash Flow (DCF) model on this occasion. Models like these may appear beyond the comprehension of a lay person, but they're fairly easy to follow.
Remember though, that there are many ways to estimate a company's value, and a DCF is just one method. For those who are keen learners of equity analysis, the Simply Wall St analysis model here may be something of interest to you.
Check out our latest analysis for Edil San Felice
What's The Estimated Valuation?
We are going to use a two-stage DCF model, which, as the name states, takes into account two stages of growth. The first stage is generally a higher growth period which levels off heading towards the terminal value, captured in the second 'steady growth' period. To start off with, we need to estimate the next ten years of cash flows. Where possible we use analyst estimates, but when these aren't available we extrapolate the previous free cash flow (FCF) from the last estimate or reported value. We assume companies with shrinking free cash flow will slow their rate of shrinkage, and that companies with growing free cash flow will see their growth rate slow, over this period. We do this to reflect that growth tends to slow more in the early years than it does in later years.
A DCF is all about the idea that a dollar in the future is less valuable than a dollar today, and so the sum of these future cash flows is then discounted to today's value:
10-year free cash flow (FCF) estimate
| 2024 | 2025 | 2026 | 2027 | 2028 | 2029 | 2030 | 2031 | 2032 | 2033 | |
| Levered FCF (€, Millions) | €5.00m | €6.50m | €6.48m | €6.51m | €6.57m | €6.66m | €6.77m | €6.89m | €7.03m | €7.17m |
| Growth Rate Estimate Source | Analyst x1 | Analyst x1 | Est @ -0.33% | Est @ 0.45% | Est @ 0.99% | Est @ 1.37% | Est @ 1.64% | Est @ 1.82% | Est @ 1.96% | Est @ 2.05% |
| Present Value (€, Millions) Discounted @ 10% | €4.5 | €5.3 | €4.8 | €4.4 | €4.0 | €3.7 | €3.4 | €3.1 | €2.9 | €2.6 |
("Est" = FCF growth rate estimated by Simply Wall St)
Present Value of 10-year Cash Flow (PVCF) = €39m
The second stage is also known as Terminal Value, this is the business's cash flow after the first stage. The Gordon Growth formula is used to calculate Terminal Value at a future annual growth rate equal to the 5-year average of the 10-year government bond yield of 2.3%. We discount the terminal cash flows to today's value at a cost of equity of 10%.
Terminal Value (TV)= FCF2033 × (1 + g) ÷ (r – g) = €7.2m× (1 + 2.3%) ÷ (10%– 2.3%) = €89m
Present Value of Terminal Value (PVTV)= TV / (1 + r)10= €89m÷ ( 1 + 10%)10= €33m
The total value is the sum of cash flows for the next ten years plus the discounted terminal value, which results in the Total Equity Value, which in this case is €72m. In the final step we divide the equity value by the number of shares outstanding. Compared to the current share price of €3.4, the company appears about fair value at a 9.0% discount to where the stock price trades currently. Remember though, that this is just an approximate valuation, and like any complex formula - garbage in, garbage out.
The Assumptions
The calculation above is very dependent on two assumptions. The first is the discount rate and the other is the cash flows. Part of investing is coming up with your own evaluation of a company's future performance, so try the calculation yourself and check your own assumptions. The DCF also does not consider the possible cyclicality of an industry, or a company's future capital requirements, so it does not give a full picture of a company's potential performance. Given that we are looking at Edil San Felice as potential shareholders, the cost of equity is used as the discount rate, rather than the cost of capital (or weighted average cost of capital, WACC) which accounts for debt. In this calculation we've used 10%, which is based on a levered beta of 1.054. Beta is a measure of a stock's volatility, compared to the market as a whole. We get our beta from the industry average beta of globally comparable companies, with an imposed limit between 0.8 and 2.0, which is a reasonable range for a stable business.
Moving On:
Valuation is only one side of the coin in terms of building your investment thesis, and it ideally won't be the sole piece of analysis you scrutinize for a company. The DCF model is not a perfect stock valuation tool. Instead the best use for a DCF model is to test certain assumptions and theories to see if they would lead to the company being undervalued or overvalued. For instance, if the terminal value growth rate is adjusted slightly, it can dramatically alter the overall result. For Edil San Felice, we've put together three pertinent items you should look at:
- Risks: Take risks, for example - Edil San Felice has 3 warning signs (and 1 which is potentially serious) we think you should know about.
- Future Earnings: How does ESF's growth rate compare to its peers and the wider market? Dig deeper into the analyst consensus number for the upcoming years by interacting with our free analyst growth expectation chart.
- Other High Quality Alternatives: Do you like a good all-rounder? Explore our interactive list of high quality stocks to get an idea of what else is out there you may be missing!
PS. Simply Wall St updates its DCF calculation for every Italian stock every day, so if you want to find the intrinsic value of any other stock just search here.
Valuation is complex, but we're helping make it simple.
Find out whether Edil San Felice is potentially over or undervalued by checking out our comprehensive analysis, which includes fair value estimates, risks and warnings, dividends, insider transactions and financial health.
View the Free AnalysisHave feedback on this article? Concerned about the content? Get in touch with us directly. Alternatively, email editorial-team (at) simplywallst.com.
This article by Simply Wall St is general in nature. We provide commentary based on historical data and analyst forecasts only using an unbiased methodology and our articles are not intended to be financial advice. It does not constitute a recommendation to buy or sell any stock, and does not take account of your objectives, or your financial situation. We aim to bring you long-term focused analysis driven by fundamental data. Note that our analysis may not factor in the latest price-sensitive company announcements or qualitative material. Simply Wall St has no position in any stocks mentioned.
About BIT:ESF
Edil San Felice
Edil San Felice S.p.A. engages in the civil and industrial construction business in Italy.
Good value with adequate balance sheet.
