Advertisement
- France
- /
- Hospitality
- /
- ENXTPA:SW
3 European Dividend Stocks Yielding Up To 4.9%

Simply Wall St
Reviewed by Simply Wall St

As the pan-European STOXX Europe 600 Index remains relatively stable amid ongoing U.S. and European trade discussions, investors are keeping a close eye on the mixed performance of major stock indexes across the continent. In this environment, dividend stocks can offer attractive income opportunities, especially when they feature strong fundamentals and resilience in times of economic uncertainty.
Top 10 Dividend Stocks In Europe
| Name | Dividend Yield | Dividend Rating |
| Zurich Insurance Group (SWX:ZURN) | 4.39% | ★★★★★★ |
| Rubis (ENXTPA:RUI) | 7.11% | ★★★★★★ |
| OVB Holding (XTRA:O4B) | 4.67% | ★★★★★★ |
| Les Docks des Pétroles d'Ambès -SA (ENXTPA:DPAM) | 5.73% | ★★★★★★ |
| Holcim (SWX:HOLN) | 4.77% | ★★★★★★ |
| HEXPOL (OM:HPOL B) | 4.77% | ★★★★★★ |
| ERG (BIT:ERG) | 5.24% | ★★★★★★ |
| DKSH Holding (SWX:DKSH) | 4.02% | ★★★★★★ |
| Banque Cantonale Vaudoise (SWX:BCVN) | 4.58% | ★★★★★★ |
| Allianz (XTRA:ALV) | 4.46% | ★★★★★★ |
Click here to see the full list of 228 stocks from our Top European Dividend Stocks screener.
Let's uncover some gems from our specialized screener.
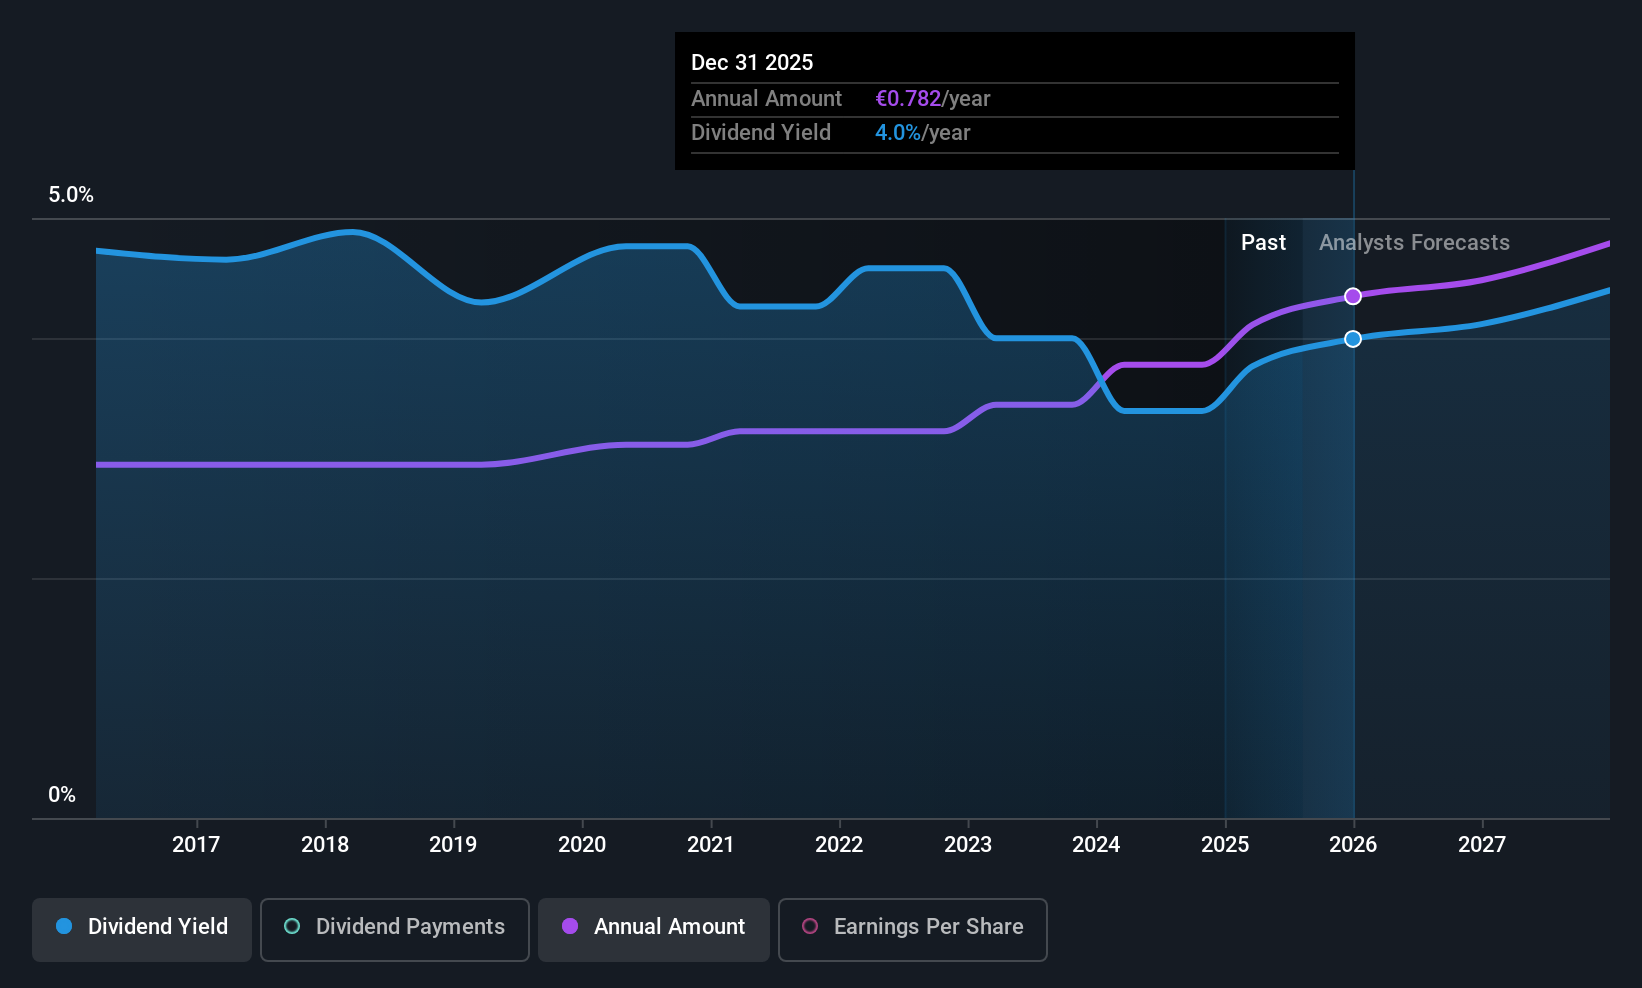
Sodexo (ENXTPA:SW)
Simply Wall St Dividend Rating: ★★★★☆☆
Overview: Sodexo S.A. is a global provider of food services and facilities management, with a market cap of €7.76 billion.
Operations: Sodexo S.A. generates its revenue from three main segments: Europe (€8.53 billion), North America (€11.33 billion), and the Rest of the World (€4.31 billion).
Dividend Yield: 5%
Sodexo's dividend payments are covered by both earnings and cash flows, with payout ratios of 57.3% and 58%, respectively. However, its dividend track record is unstable due to volatility over the past decade. Recent revenue announcements show modest growth, with third-quarter revenues at €6.12 billion compared to €6.07 billion a year ago. The company has initiated a share buyback program worth up to €1.60 billion, potentially impacting future dividend sustainability given its high debt levels.
- Dive into the specifics of Sodexo here with our thorough dividend report.
- Our valuation report here indicates Sodexo may be undervalued.

Kemira Oyj (HLSE:KEMIRA)
Simply Wall St Dividend Rating: ★★★★★☆
Overview: Kemira Oyj is a chemicals company with operations across Finland, the rest of Europe, the Middle East, Africa, the Americas, and the Asia Pacific, and it has a market cap of approximately €2.98 billion.
Operations: Kemira Oyj's revenue is primarily generated from its Water Solutions segment, which amounts to €1.25 billion.
Dividend Yield: 3.8%
Kemira Oyj offers a stable dividend, supported by a payout ratio of 50.8% and cash flow coverage at 52.2%. Despite recent revenue declines—EUR 693.4 million for Q2 compared to EUR 733.4 million last year—the dividend remains reliable with consistent growth over the past decade. Trading below fair value enhances its appeal, although recent guidance revisions indicate potential challenges ahead, with expected revenue now between EUR 2.7 billion and EUR 2.95 billion for the full year.
- Navigate through the intricacies of Kemira Oyj with our comprehensive dividend report here.
- Our comprehensive valuation report raises the possibility that Kemira Oyj is priced lower than what may be justified by its financials.
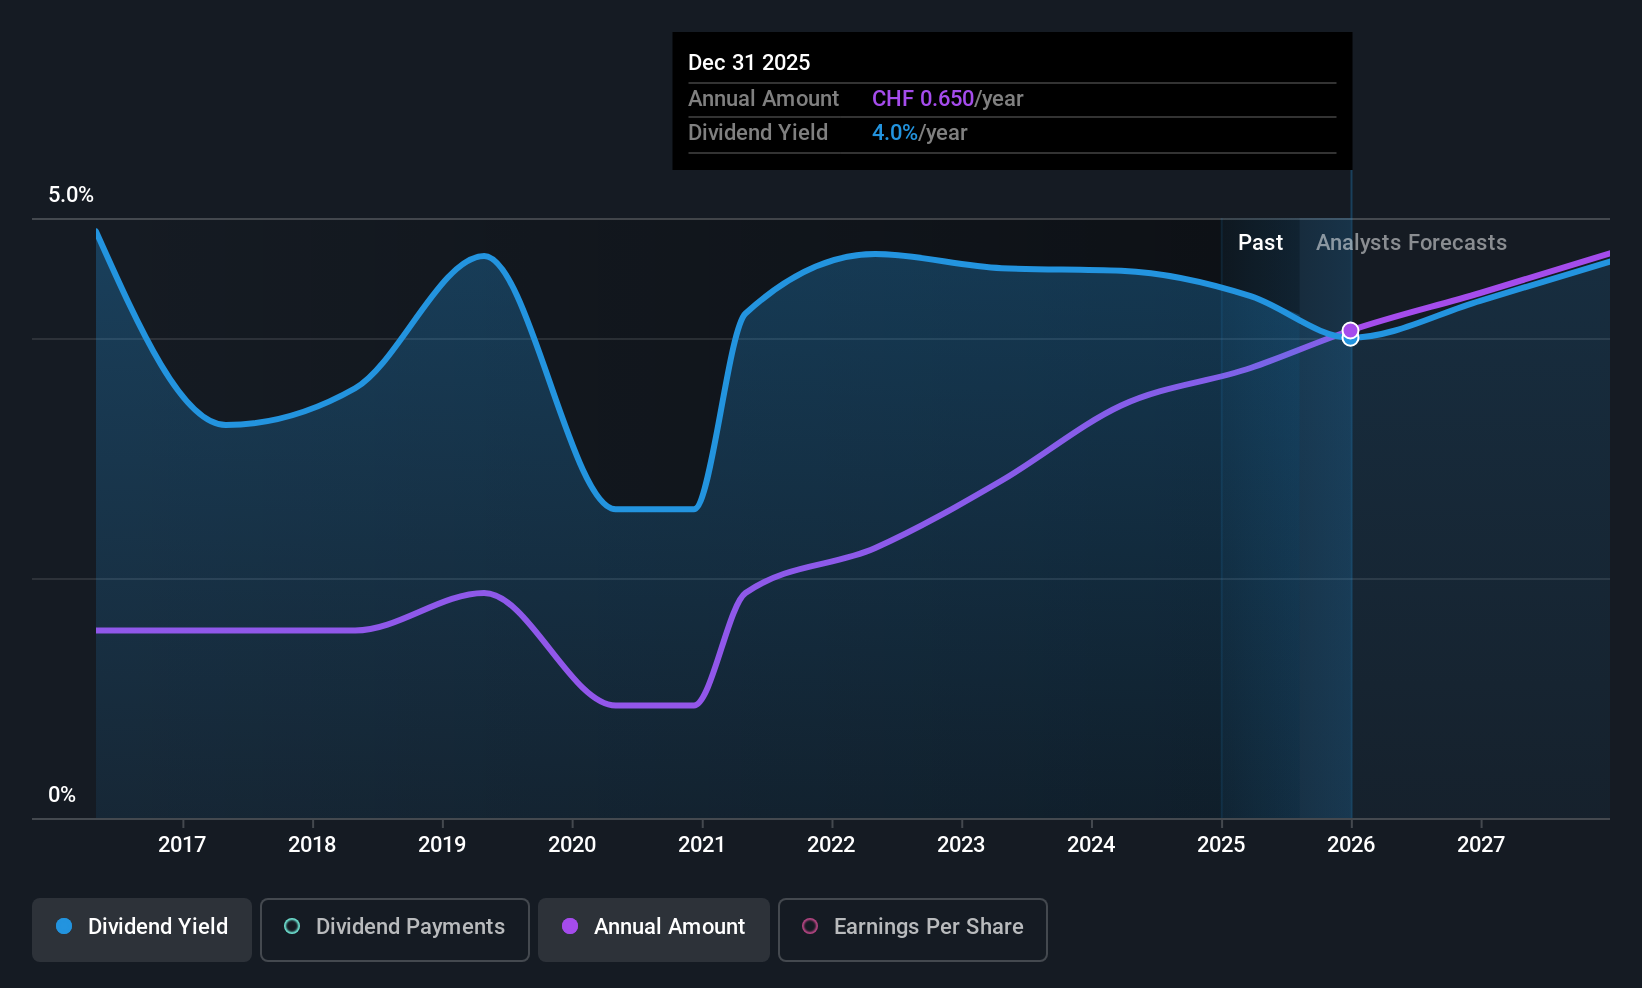
EFG International (SWX:EFGN)
Simply Wall St Dividend Rating: ★★★★☆☆
Overview: EFG International AG, along with its subsidiaries, offers private banking, wealth management, and asset management services and has a market cap of CHF4.98 billion.
Operations: EFG International AG generates revenue through its core operations in private banking, wealth management, and asset management services.
Dividend Yield: 3.6%
EFG International's net income rose to CHF 221.2 million for H1 2025, up from CHF 162.8 million a year ago, with earnings per share also showing improvement. While the dividend yield of 3.61% is below top-tier levels in Switzerland, dividends are covered by earnings with a payout ratio of 59.9%. However, its dividend history is marked by volatility and unreliability over the past decade despite some growth in payments during this period.
- Click to explore a detailed breakdown of our findings in EFG International's dividend report.
- Our expertly prepared valuation report EFG International implies its share price may be too high.
Make It Happen
- Investigate our full lineup of 228 Top European Dividend Stocks right here.
- Got skin in the game with these stocks? Elevate how you manage them by using Simply Wall St's portfolio, where intuitive tools await to help optimize your investment outcomes.
- Discover a world of investment opportunities with Simply Wall St's free app and access unparalleled stock analysis across all markets.
Looking For Alternative Opportunities?
- Explore high-performing small cap companies that haven't yet garnered significant analyst attention.
- Fuel your portfolio with companies showing strong growth potential, backed by optimistic outlooks both from analysts and management.
- Find companies with promising cash flow potential yet trading below their fair value.
This article by Simply Wall St is general in nature. We provide commentary based on historical data and analyst forecasts only using an unbiased methodology and our articles are not intended to be financial advice. It does not constitute a recommendation to buy or sell any stock, and does not take account of your objectives, or your financial situation. We aim to bring you long-term focused analysis driven by fundamental data. Note that our analysis may not factor in the latest price-sensitive company announcements or qualitative material. Simply Wall St has no position in any stocks mentioned.
New: Manage All Your Stock Portfolios in One Place
We've created the ultimate portfolio companion for stock investors, and it's free.
• Connect an unlimited number of Portfolios and see your total in one currency
• Be alerted to new Warning Signs or Risks via email or mobile
• Track the Fair Value of your stocks
Have feedback on this article? Concerned about the content? Get in touch with us directly. Alternatively, email editorial-team@simplywallst.com
About ENXTPA:SW
Sodexo
Provides food services and facilities management services worldwide.
Undervalued with adequate balance sheet and pays a dividend.
Similar Companies
Market Insights


Advertisement
Community Narratives
A Quality Compounder Marked Down on Overblown Fears
Fair Value US$120.72|59.6% undervalued
BA
Community Contributor

Wyndham Continues Global Expansion with 19% Ancillary Revenue Growth
Fair Value US$105.80|20.1% undervalued
ZW
Community Contributor