Last Update 29 Oct 24
Fair value Increased 11%Enphase Struggles To Recover As Management Downgrades Growth Estimates
- Enphase is slowly recovering sales from the drop in the last 12-months. I maintain that 2024 will be a down year, and the company will start recovering in 2025.
- The U.S. market will be the basis for recovery as European industry is in distress.
- I am revising down my SAM estimates for 2029 from 50% to 40%, targeting revenue of $3.6B.
- The success of Enphase is dependent on sales, so I am comfortable maintaining my profit margin estimate at 20%.
- 2024 is turning out worse than I expected in my original narrative.
Enphase published their Q3’24 report, and the stock dropped more than 16% on the announcement.
Revenue was $380.9M, down 30% YoY, and up 25.5% versus the previous quarter. This indicates that demand is picking back up and the worst of the demand slump is behind Enphase.

Enphase: Financial results ending Q3 2024
Operating expenses were 33.7% of revenues vs. the 28.5% one year ago. The company continues to spend more while getting relatively lower revenues.
The fluctuation in revenue per operating expenses isn’t a value judgment on the company (they have been relatively consistent with the spend), but an indication that sales are highly dependent on external factors such as NEM regulation, consumer demand, tax credits & subsidies. To this end, analyzing the direction of the economy is just as important for ENPH investors as analyzing the company and product itself.
On a geo-segment basis, quarterly revenue in the U.S. increased about 34% from last quarter, and dropped 15% in Europe during the same period. It seems that the U.S. consumer is rebounding while Europe continues to decline. Considering the economic weakness in Germany (1, 2), I don’t expect the situation in the European market to improve soon.
A Stagnating Outlook Can Move The Stock Towards Its Present Value
Enphase came out with a Q4 revenue forecast in the range of $360M to $400M.
While this has a chance to produce higher revenues than the Q3 result at $380M, investors should be mindful that the estimate is $10M lower than their previous forecast for Q3 (when ENPH made $380.9M), which ranged from $370M to $410M.
In other words, the midpoint forecast of $380M for Q4 is 2.6% lower than the one in Q3.
Management using performance comparisons from YoY to QoQ is not common, and is likely intended to serve as an indication that sales are picking up after a weak-demand year. While this is true, the forecast downgrade indicates that we may not be able to expect this acceleration to continue, and could be due for another slow quarter.
In the absence of the expectation of growth, we may see the valuation of the company shifting from a premium towards the value of what the company can produce in the near future.
Valuation Revision
I am downgrading my SAM share for Enphase from 50% to 40%, resulting in around $3.6B for 2029. Most of the decline is tied to my commercial sales SAM estimate, as companies tighten their budgets on discretionary items, while consumers are kept resilient by government incentives.
I still expect the company to be able to reach 50% of its SAM. However this will come later, so it is no longer incorporated into my present value.
For 2025 I expect the company to be able to increase sales to $1.7B and grow to $3.6B in 2029.
The company is well structured, so I’m maintaining my margin estimates at 20%, leading to a 2029 net income estimate of $720M. At a 23x PE I get a 2029 value of $16.6B, around $120 per share. Discounted back using my 9.7% rate, I get a revised present value at $10.4B or $76.7 per share.
Key Takeaways
- Electricity prices, incentives (tax credits, net metering) and technology advancements will drive sales.
- Microinverters are gaining traction but their advantage over traditional inverters is unclear.
- Long 25-year warranties have not proven themselves, raising concerns about durability.
- Battery technology is being commoditized, leaving the added value to be derived from microinverters.
- The solar industry is in a downturn, and valuations are highly dependent on signs of recovery.
Catalysts
Microinverters Are Leading, But There Isn’t A Clear Technological Winner
Enphase has entered the renewable energy scene with their microinverter technology which allows them to control the electricity flow on an individual panel. Customers have been receptive to this technology because it allows for granular control over solar panels, keeps the home grid working in the event of a panel failure and optimizes electricity generation even in panels with partial shade or covering e.g. falling leaves.
The company has shipped more than 73M microinverters, and approximately 4M Enphase residential and commercial systems have been deployed in more than 150 countries (p. 7), with the expectation of producing more than 7.5 million microinverters per quarter. The company is ensuring its competitive moat by employing patents that are valid through 2044, without a material portion expiring in the near future.
There are indications that a good chunk of customer orders in the solar industry are for microinverters. This is based on the novelty effect in the field making consumers associate innovation with quality. Enphase’s marketing has also been highly effective in selling the concept, to the point where customers are asking specifically for microinverters instead of the traditional string inverters, which are a single point of failure inverter technology. Installers are on-board with this because of the demand as well as the relatively higher price for microinverters for smaller housing units.
However, there are some issues (1, 2) to consider. For a few additional units, string inverters scale better than microinverters – that is, the price to expand a solar installation is cheaper per new solar unit on a central system, but costs the same for every new microinverter an owner needs to add.
Central systems are easier to repair for installers but the cost may vary for the owner depending on the defect. String inverters can be combined with power optimizers to drive efficiency – with a key advantage of this being that power optimizers are cheaper to replace than microinverters.
Should installers start facing a larger number of customer complaints for microinverters, they will have difficulty sharing their reputation-hit with the manufacturer and will gradually start discouraging new customers from buying microinverters. This can lead to higher sales and marketing costs for Enphase, as they will have to push sales incentives for partnerships with installers.
Enphase’s Warranty Still Needs To Pass The Field Test
Enphase issues a 25 year warranty on most microinverters, especially newer generation ones. This is a very appealing part of the sales pitch. Given that the technology doesn’t have a 25-year track record, a good question to ask is how likely is this 25 year warranty to hold up? Theoretically it seems fine, the microinverters have been tested and engineers have valued a 25-year warranty (p. 60).
It's a durable piece of hardware that generates less heat from operations, but there are two problems with it. First, it uses electrical components, which tend to break down over time – think of how old is the oldest electrical device in your house.
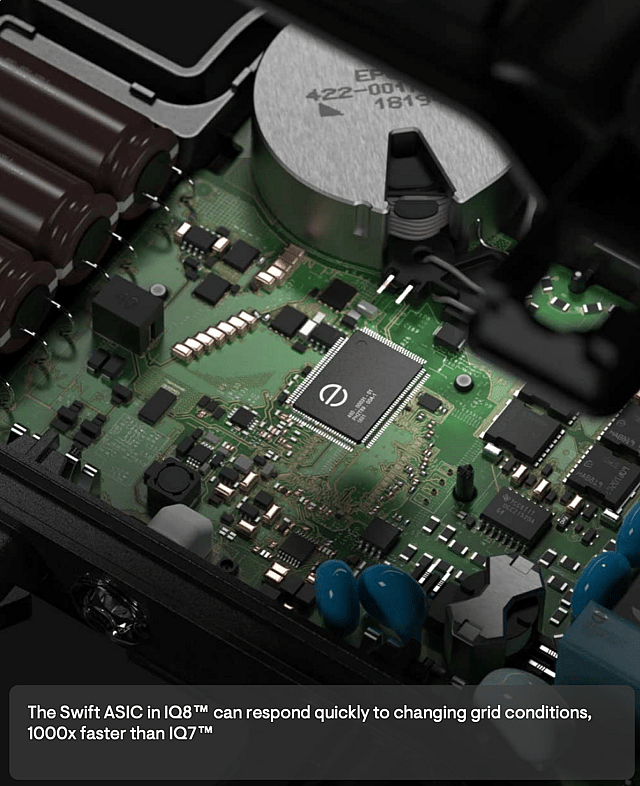
Enphase presentation: inverter electronics placement
Second, microinverters are mounted just below the panels and therefore exposed to the outside weather, so we should factor-in high Texas and Florida temperatures, as well as general moist/foggy conditions in Europe. This makes the electronic devices within microinverters vulnerable to outside weather conditions, and I don’t see what protects Enphase chips in this scenario.
There is also the problem of factoring-in extreme events, as warranty reserves estimate a linear probability of failure which increases as the device ages every year. However, an extreme weather event such as a prolonged heat wave may happen once in <25 years and wipe out a high percentage of the exposed electronics, leading to a spike in warranty obligations.
Should this hypothesis be right, the company will face a larger portion of warranty claims down the line, which will also have knock-on effects on the contract installers that will be less favorable to Enphase’s product when it comes to pitching to end customers.
It seems that microinverters led by Enphase are capturing most of the residential solar market at the moment, and while the company is a clear leader in this space, I’m not convinced that the underlying technology will help them sustain their leadership position, and estimate a normalization of market share in the future (discussed below).
Solar Tax Credits Will Keep Incentivizing Residential Customers In The Next Ten Years
The company is well-positioned to benefit from the Inflation Reduction Act (IRA) in the US (p. 14), which extends tax credits for solar installations. The ITC tax deduction program is extended until 2032 allowing qualifying homeowners to deduct 30% of the cost of installing residential solar systems from their U.S. federal income taxes. Under the terms of the current extension, the ITC will remain at 30% through the end of 2032, reduce to 26% for 2033, reduce to 22% for 2034, and further reduce to 0% after the end of 2034.
This measure is most appealing to earners with taxable income, which is arguably a portion of the customers that can be considered low-hanging fruit and have already signed up. It may be an uphill battle to convince lower-middle class Americans to sign up for solar, as the organic incentives for solar are far smaller when you count out subsidies.
Increasing Electricity Costs Sustain The Long-Term Viability Of Solar As A Tax Deductible Investment
Electricity prices have been consistently increasing, which represents an organic tailwind for solar adoption in places with high sunlight and cost saving opportunities due to high electricity bills.
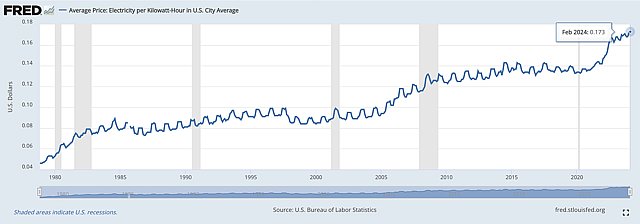
Average Price: Electricity per Kilowatt-Hour in U.S. City Average - St Louis Fed
Barring a significant shift to nuclear energy, it seems that electricity will be in increasing demand due to the growth in electrical components for everyday use and a sizable shift to electric vehicles. This will sustain price upticks for electricity and customers within suitable regions may consider solar as a way to offset rising costs.
Solar Is In A Down-Cycle Driven By A Declining Consumer Demand And A Reduction Of Incentives
Demand for solar adoption was high in 2021 backed by a mix of increasing electricity prices, tax deduction incentives, and discretionary spending available to invest in solar as a yield generating asset. On the financing side, people were privy to low-cost loans backed by green bonds on a state level both in the US and EU.
Unfortunately, the solar boom ended in the second half of 2023 as the industry entered a down-cycle. We can see a proxy of this happening by looking at the total number of people employed in the industry – which has risen in 2021, peaked in 2022, and significantly declined in 2023. We can also examine the top-line performance of key solar companies such as: Enphase (ENPH), SMA Solar (S92), Canadian Solar (CSIQ), SolarEdge (SEDG), Array (ARRY), SunPower (SPWR), NextEra (NEE), Tygo (TIGO), etc, and see the decline in revenues. Besides the current slump, for most of the mentioned companies analysts are estimating the decline to continue to the end of 2024, after which they see a recovery taking place.
In the mentioned period, Enphase experienced reduced demand driven by:
- General lower demand, and a lower demand for batteries.
- Transition from NEM 2 to NEM 3 in California resulting in an increased investment payback period for customers.
- A normalization from the surge in renewable energy sales in Europe resulting from the invasion of Ukraine. EU net billing policies are also experiencing uncertainty.
Storage Demand Is Pressuring Sales
Even with the current headwinds, Enphase managed to sell roughly the same number of microinverters by the 2023 year end – 15.5M, vs 15.4M in 2022 (p. 53). The main weakness was exhibited in battery sales, as their shipments decreased to 352 MWh, down from 509 MWh in 2022. There are two key reasons for this, one is that consumers are cutting down on spending, and the other is the increased competition now available for battery installations.
Competitors are particularly important as they lead to the commoditization of battery systems, eliminating much of the alpha from powerwalls. Key peers in this space include: Tesla, SolarEdge, Huawei, LG Chem, BYD and other producers of battery cells and integrated storage systems market.
Besides batteries, Enphase has to compete with traditional inverter sellers, as well as inverters enhanced by power optimizer systems that deliver a comparable performance at a lower price. Peers in this space consist of: SolarEdge, Tesla, Huawei, Sungrow Power Supply, Growatt New Energy, Tygo, SMA Solar, Canadian Solar and other companies offering string inverters with and without solar optimizers.
Moving From NEM 2 to NEM 3 Increases The Payback Period For Solar
In December 2022, California passed NEM 3, which has been effective since April 15, 2023. The new policy reduces the net metering compensation earned by solar customers selling extra energy to the grid by more than 70%.
Previously, residents used the grid to sell excess electricity and offset their bill, however this put a strain on the grid when electricity was abundant (daytime), so the state moved away from compensating for solar and is pushing residents to adopt batteries instead of compensation as the primary way to offset their electricity bills.
This means additional upfront costs for people wanting to adopt solar, an increased risk of fire in the household and an increased time to breakeven on an investment since batteries typically cost between $5K to $15K.
EU Is Undecided How It Will Move Forward With Net Billing - Impacting Residential Solar
Europe sales are a key growth avenue for Enphase, with the Netherlands alone constituting 15% of revenue. In the last few years, sales have been supported by positive EU sustainability policy and higher electricity prices. However, prices are now normalizing and the organic incentives for adopting solar are decreasing.
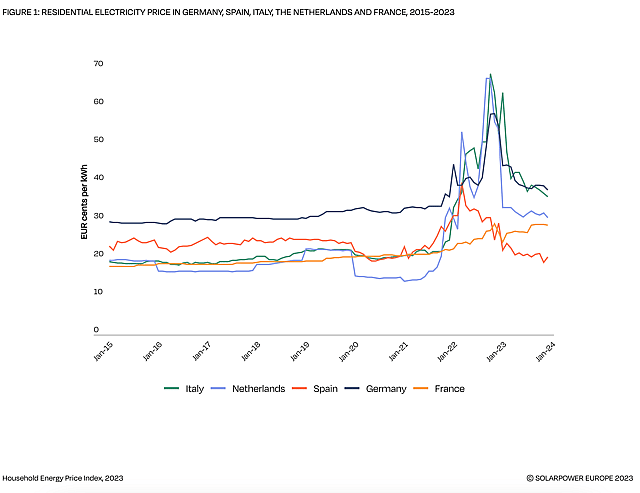
Solar Power Europe Report: EU Market Outlook for Solar Power 2023-2027
Individual EU countries are debating their net metering/billing policies, and while it is uncertain the exact direction they will take, it will likely be a path that incentivizes citizens to integrate batteries and avoid straining existing grids.
A report on EU’s solar outlook notes the need to revitalize old infrastructure as well as cut down on the long bureaucratic process for solar permits. The report argues that while the EU has been attempting to shorten the lengthy permit processes it has been failing and this remains a hurdle in solar adoption. The report also indicates a base case for annual solar growth of 11%, in line with the recovery expectations.
Headwinds Have Resulted In Stagnation
The mix of higher financing rates, reduction of incentives, and a longer time to breakeven for solar systems have resulted in solar being a much less appealing investment for residential customers, and analysts expect this headwind to persist until the end of 2025.
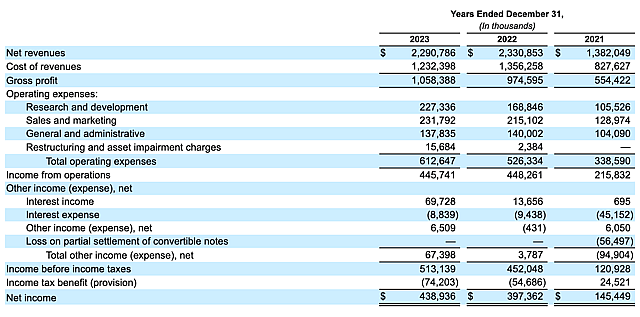
This has unfolded within Enphase’s sales efficiency and marketing costs. By analyzing the income statement of the last three years we can see that the company has to burn more on marketing expenses in order to sustain 2022 sales levels. We can see that over the years Enphase generated $9.9, $10.8, and $10.7 dollars for every $1 invested in sales and marketing respectively.
Enphase’s Serviceable Addressable Market (SAM) Is Not Justified
While past performance gives us a basis to build upon, we need to review whether Enphase can recover and surpass previous results. Currently, analysts are modeling revenues of $1.6B by 2025. However, they extrapolate that Emphase will recover 2023 revenue levels by 2027. This needs to be consistent with the growth potential of Enphase, which I analyze below.
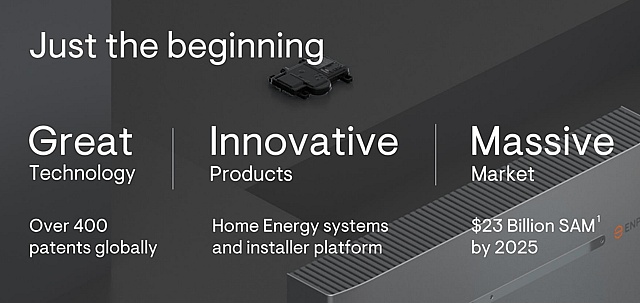
Enphase 2024 Presentation: Internal Serviceable Available Market (SAM) Estimates From 2021
Management hasn’t updated its SAM estimates in 3 years. The issue here is that government incentives (such as NEM 3) have changed and factoring that in would lead to a lower SAM. In my opinion, if the SAM was going in the other direction, i.e. growing, we would have annual estimate updates at minimum.
Here is management’s breakdown of the 2025 SAM:
- Solar: $8.2B
- Storage: $4.5B
- Portable energy: $2.5B
- EV charger: $6B
- AC fuel cell: $1.5B
This is why I believe the SAM in the latest presentation is somewhat inflated, not because it’s misrepresented, but because segments like battery storage and EV chargers make up the majority of the SAM, while microinverters are Enphase’s core product, and the only product in which they are competitive.
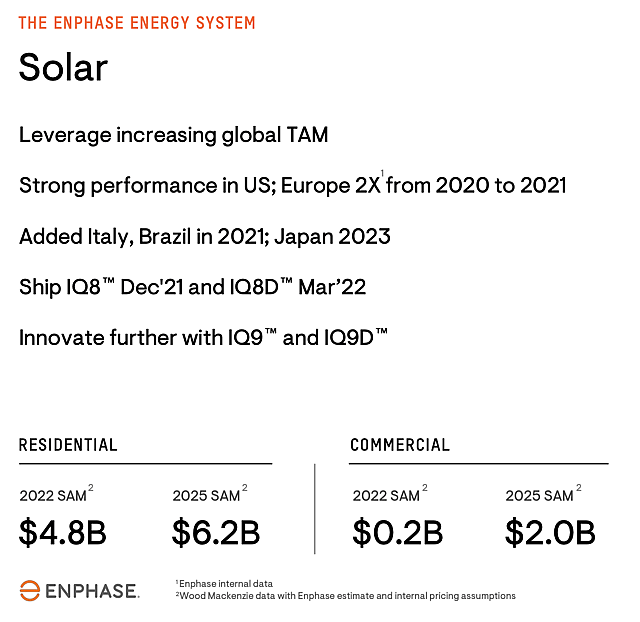
Enphase 2021 Investor Presentation: Microinverter SAM
When we break down the SAM into components, we find that the 2021 presentation that cites the same sources, displays a 2025 microinverter total SAM of $8.2B – comprising $6.2B residential and $2B in commercial sales.
Given the change in government incentives and economic pressure, I will modify my SAM estimate by giving the residential segment a 50% cut, and maintaining the commercial SAM. This is because consumers are the most affected by the change of policy, while businesses continue to be incentivized to implement solar and have more taxable income to offset the upfront costs. This leads me to my estimated microinverter SAM of $5.1B for 2025. I view the remaining products (batteries, charging, etc) of Enphase to make up to 20% of its revenue, leading to a total SAM of $6.12B for 2025.
I estimate that the SAM growth will be primarily backed by government incentives leading to a 10% annual expansion and a value around $9B in 2029.
Assumptions
- Market dynamics: I estimate that Enphase will continue to be in the market leadership position in the next five years, but their product will be increasingly challenged after that. The rationale behind this is that installers will encounter an increasing number of warranty obligations and start offering customers string inverters as a better price-to-performance alternative. This manifests as a high market share initially, but a multiple downgrade in year 5.
- Sales: Given this expectation, I estimate that Enphase manages to convert 50% of the SAM into sales in 2029. The company will enter into a recovery after fiscal 2024, and grow revenue to $4.5B starting from a basis of $1.7B in fiscal 2024. This results in a 21% annual growth rate for the period between 2025 to 2029.
- Profitability: Margins are scalable in this business, and I expect the company to be able to maintain 20% margins in 2029. The resulting net income is around $900M in 2029.
- Share count: Enphase is still in a period where it has to reinvest into the business in order to be able to scale growth. I expect the company to be net neutral on the number of shares, and leave the outstanding shares number at 136M in 2029.
- Multiple: I assume that Enphase starts losing its microinverter leadership position and normalizes market share with string inverter peers. This will lead investors to be less enthusiastic about growth in 2029, and re-rate the PE multiple from 35x today to 23x in five years.
Risks
- Microinverters could prove to be the right technology: This is the key counterweight to my narrative, and would result in higher revenue than I estimated.
- Organic growth picks up: Most of the solar growth is due to incentives and the payback period for a solar investment. Should customers find themselves in a lower rate environment or anticipate higher energy costs, then organic sales may start picking up.
- Technological breakthroughs: Should the cost of components go down, or conversely efficiency increase, then solar installations will shorten their payback period of 5 to 7 years, leading to a higher viability for residential customers.
- Reduction of bureaucracy and more government incentives: Should countries adopt a more aggressive approach to pushing solar, the market may increase adoption. Conversely, cutting the number of needed permits or digitalizing the process may lead to shorter wait-time for solar.
How well do narratives help inform your perspective?
Disclaimer
Simply Wall St analyst Goran_Damchevski holds no position in NasdaqGM:ENPH. Simply Wall St has no position in the company(s) mentioned. Simply Wall St may provide the securities issuer or related entities with website advertising services for a fee, on an arm's length basis. These relationships have no impact on the way we conduct our business, the content we host, or how our content is served to users. This narrative is general in nature and explores scenarios and estimates created by the author. The narrative does not reflect the opinions of Simply Wall St, and the views expressed are the opinion of the author alone, acting on their own behalf. These scenarios are not indicative of the company's future performance and are exploratory in the ideas they cover. The fair value estimate's are estimations only, and does not constitute a recommendation to buy or sell any stock, and they do not take account of your objectives, or your financial situation. Note that the author's analysis may not factor in the latest price-sensitive company announcements or qualitative material.


