Key Takeaways
- Robust backlog and strong service demand signal potential for consistent revenue growth, supported by aviation aftermarket and operational improvements.
- Strategic R&D investment and lean operations enhance product innovation and margin improvement, while U.S. manufacturing expansion boosts supply chain resilience.
- Tariffs, supply chain issues, and macroeconomic conditions present risks to revenue growth and net margins, amid uncertain demand and equipment delivery challenges.
Catalysts
About General Electric- General Electric Company, doing business as GE Aerospace, designs and produces commercial and defense aircraft engines, integrated engine components, electric power, and mechanical aircraft systems.
- GE Aerospace is executing a $170 billion-plus backlog, indicating robust future revenue streams, particularly if supply chain constraints can be addressed, supporting consistent revenue growth.
- With a commitment of approximately $3 billion annually in R&D, GE Aerospace is advancing technologies that could lead to new product offerings and enhancement of existing ones, potentially improving earnings and margins over time.
- The FLIGHT DECK lean operating model is being leveraged to tackle supply chain issues and optimize operations, which could lead to better cost control and operational efficiency, thereby positively impacting net margins.
- GE Aerospace is seeing significant growth in service orders and revenue, indicating strong aftermarket demand that is essential to high-margin revenue streams, supporting overall margin and earnings improvements.
- Efforts to expand U.S. manufacturing and hire 5,000 workers could enhance domestic operational capacity, potentially reducing foreign dependency and improving supply chain resilience, translating into stable revenue and profit growth.
General Electric Future Earnings and Revenue Growth
Assumptions
How have these above catalysts been quantified?- Analysts are assuming General Electric's revenue will grow by 7.1% annually over the next 3 years.
- Analysts assume that profit margins will shrink from 17.4% today to 16.7% in 3 years time.
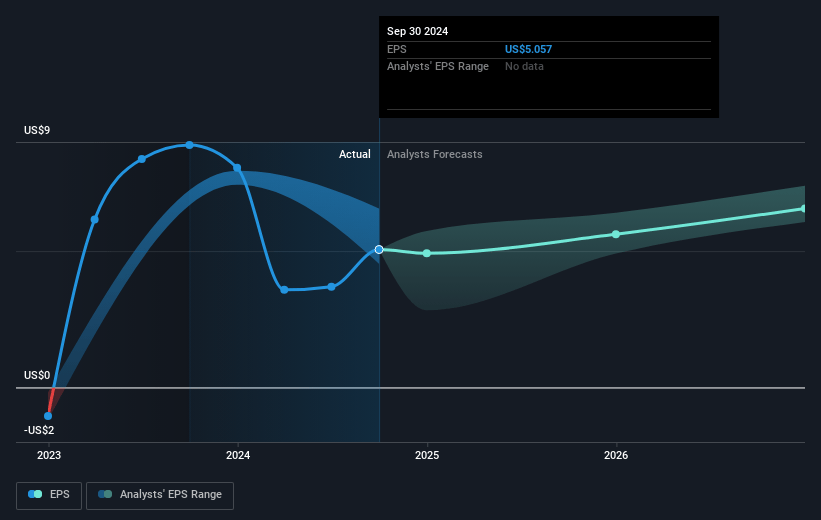
- Analysts expect earnings to reach $8.2 billion (and earnings per share of $8.14) by about April 2028, up from $6.9 billion today. However, there is some disagreement amongst the analysts with the more bearish ones expecting earnings as low as $6.5 billion.
- In order for the above numbers to justify the analysts price target, the company would need to trade at a PE ratio of 32.5x on those 2028 earnings, up from 31.0x today. This future PE is greater than the current PE for the GB Aerospace & Defense industry at 31.7x.
- Analysts expect the number of shares outstanding to decline by 2.58% per year for the next 3 years.
- To value all of this in today's terms, we will use a discount rate of 6.35%, as per the Simply Wall St company report.
General Electric Future Earnings Per Share Growth
Risks
What could happen that would invalidate this narrative?- The implementation of tariffs and the uncertainty around further tariff escalation pose significant risks, potentially increasing costs by approximately $500 million, which could negatively impact net margins.
- Supply chain constraints and a backlog in converting orders to revenue due to spare parts delinquency, which has increased over 2x year-over-year, could slow down revenue growth and affect earnings.
- Shifts in departure growth projections to low single digits and potential decreases in North American departures introduce uncertainty in demand, which may impact revenue and earnings.
- The slowing of material inputs and engine unit deliveries in the first quarter, with LEAP engine deliveries down 13%, could affect equipment revenue and margins if not resolved quickly.
- External macroeconomic conditions, such as potential slowdowns in airframer delivery schedules or global recessions, could further complicate revenue projections and impact overall profit forecasts.
Valuation
How have all the factors above been brought together to estimate a fair value?- The analysts have a consensus price target of $223.492 for General Electric based on their expectations of its future earnings growth, profit margins and other risk factors. However, there is a degree of disagreement amongst analysts, with the most bullish reporting a price target of $261.0, and the most bearish reporting a price target of just $191.34.
- In order for you to agree with the analyst's consensus, you'd need to believe that by 2028, revenues will be $48.7 billion, earnings will come to $8.2 billion, and it would be trading on a PE ratio of 32.5x, assuming you use a discount rate of 6.4%.
- Given the current share price of $200.5, the analyst price target of $223.49 is 10.3% higher.
- We always encourage you to reach your own conclusions though. So sense check these analyst numbers against your own assumptions and expectations based on your understanding of the business and what you believe is probable.
How well do narratives help inform your perspective?
Disclaimer
Warren A.I. is a tool utilizing a Large Language Model (LLM) that ingests data on consensus price targets, forecasted revenue and earnings figures, as well as the transcripts of earnings calls to produce qualitative analysis. The narratives produced by Warren A.I. are general in nature and are based solely on analyst data and publicly-available material published by the respective companies. These scenarios are not indicative of the company's future performance and are exploratory in nature. Simply Wall St has no position in the company(s) mentioned. Simply Wall St may provide the securities issuer or related entities with website advertising services for a fee, on an arm's length basis. These relationships have no impact on the way we conduct our business, the content we host, or how our content is served to users. The price targets and estimates used are consensus data, and do not constitute a recommendation to buy or sell any stock, and they do not take account of your objectives, or your financial situation. Note that Warren A.I.'s analysis may not factor in the latest price-sensitive company announcements or qualitative material.


