

Key Takeaways
- Dependence on M&A for growth risks overvaluation if expected synergies don't materialize, impacting revenue and market perception.
- Heavy capital investments in tech and greenfield projects could squeeze net margins if anticipated efficiencies or revenues fall short.
- RB Global's strategic focus on technology, partnerships, and global expansion could drive revenue growth, improve market share, and enhance earnings potential.
Catalysts
About RB Global- Operates a marketplace that provides insights, services, and transaction solutions for buyers and sellers of commercial assets and vehicles worldwide.
- RB Global anticipates significant growth through strategic M&A activities to expand market reach. While M&A could bolster capabilities, over-reliance on acquisitions for growth could lead to a potential overvaluation if these activities do not deliver anticipated revenue synergies.
- The company's heavy investments in modernizing technology and expanding greenfield projects, particularly in Australia, require increased capital expenditure. If these investments do not yield expected efficiencies or revenues, net margins could be compressed, potentially indicating overvaluation.
- The automotive sector of RB Global is benefiting from secular growth trends, such as the spread between repair cost inflation and used vehicle inflation. However, if these favorable conditions reverse, such as through regulatory changes or decreased vehicle valuations, revenue growth may be limited.
- The commercial construction and transportation segment recorded a GTV decline, partially offset by increased lot volumes but driven by asset value deflation. If asset values continue to decline, earnings from these sectors could be weaker than forecasted.
- Market share and GTV growth projections between 0% to 3% in 2025 suggest modest performance expectations. Any headwinds such as macroeconomic uncertainties or competition that dampen this outlook could affect earnings adversely, pointing to a risk of stock overvaluation if growth fails to meet expectations.
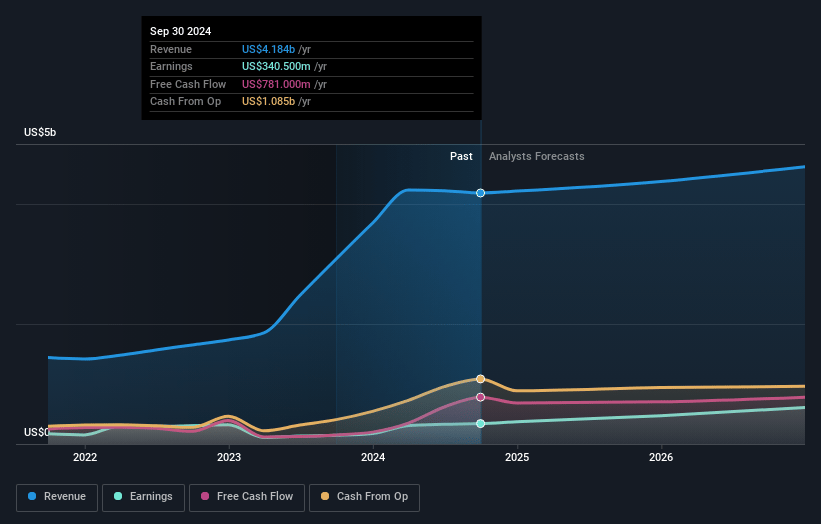
RB Global Future Earnings and Revenue Growth
Assumptions
How have these above catalysts been quantified?- This narrative explores a more pessimistic perspective on RB Global compared to the consensus, based on a Fair Value that aligns with the bearish cohort of analysts.
- The bearish analysts are assuming RB Global's revenue will grow by 3.1% annually over the next 3 years.
- The bearish analysts assume that profit margins will increase from 8.7% today to 13.4% in 3 years time.
- The bearish analysts expect earnings to reach $629.3 million (and earnings per share of $3.39) by about April 2028, up from $372.7 million today. The analysts are largely in agreement about this estimate.
- In order for the above numbers to justify the price target of the more bearish analyst cohort, the company would need to trade at a PE ratio of 33.5x on those 2028 earnings, down from 48.4x today. This future PE is greater than the current PE for the CA Commercial Services industry at 27.9x.
- Analysts expect the number of shares outstanding to grow by 0.56% per year for the next 3 years.
- To value all of this in today's terms, we will use a discount rate of 6.95%, as per the Simply Wall St company report.
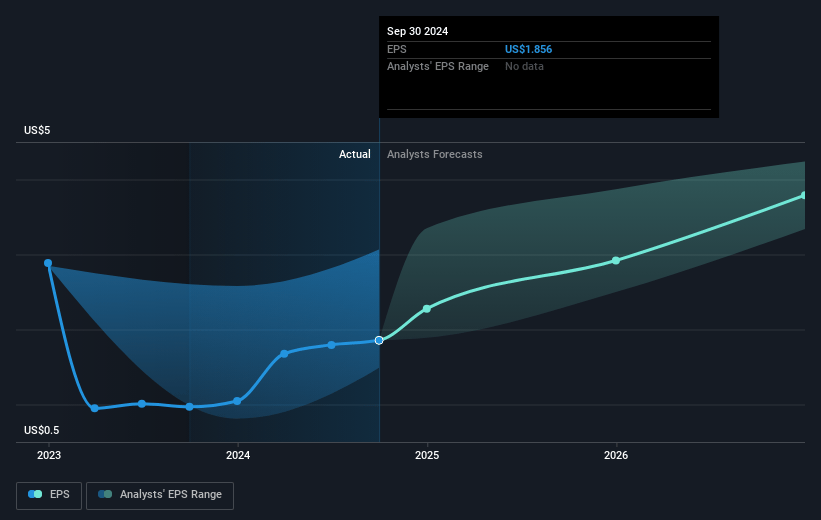
RB Global Future Earnings Per Share Growth
Risks
What could happen that would invalidate this narrative?- RB Global's strategic focus on driving premium price performance and enhancing liquidity through technology and an expanded global buyer base could lead to increased market share and higher gross transactional value, potentially bolstering future revenue.
- The company's effort to grow its enterprise partner base, including insurance companies and large fleet owners, by optimizing lifecycle management and minimizing maintenance costs, positions RB Global to strengthen its market positioning and potentially improve net margins.
- RB Global’s ongoing investment in technology and omnichannel marketplace enhancements, such as the acquisition of Boom & Bucket and the launch of rbauction.com, may support scalable growth and efficient operations, possibly leading to increased earnings.
- The achieved international buyer growth in the automotive sector, and record high vehicle sales to international buyers, suggest potential for increased sales volumes and revenue growth.
- Strategic geographical expansions, like the greenfield investment in Australia, are aimed at capturing new market opportunities, which could drive revenue growth and improve earnings through enhanced market reach.
Valuation
How have all the factors above been brought together to estimate a fair value?- The assumed bearish price target for RB Global is $91.74, which represents one standard deviation below the consensus price target of $108.7. This valuation is based on what can be assumed as the expectations of RB Global's future earnings growth, profit margins and other risk factors from analysts on the more bearish end of the spectrum.
- However, there is a degree of disagreement amongst analysts, with the most bullish reporting a price target of $120.0, and the most bearish reporting a price target of just $60.0.
- In order for you to agree with the bearish analysts, you'd need to believe that by 2028, revenues will be $4.7 billion, earnings will come to $629.3 million, and it would be trading on a PE ratio of 33.5x, assuming you use a discount rate of 7.0%.
- Given the current share price of $97.38, the bearish analyst price target of $91.74 is 6.2% lower. The relatively low difference between the current share price and the analyst bearish price target indicates that they believe on average, the company is fairly priced.
- We always encourage you to reach your own conclusions though. So sense check these analyst numbers against your own assumptions and expectations based on your understanding of the business and what you believe is probable.
How well do narratives help inform your perspective?
Disclaimer
AnalystLowTarget is an employee of Simply Wall St, but has written this narrative in their capacity as an individual investor. AnalystLowTarget holds no position in NYSE:RBA. Simply Wall St has no position in the company(s) mentioned. Simply Wall St may provide the securities issuer or related entities with website advertising services for a fee, on an arm's length basis. These relationships have no impact on the way we conduct our business, the content we host, or how our content is served to users. This narrative is general in nature and explores scenarios and estimates created by the author. The narrative does not reflect the opinions of Simply Wall St, and the views expressed are the opinion of the author alone, acting on their own behalf. These scenarios are not indicative of the company's future performance and are exploratory in the ideas they cover. The fair value estimate's are estimations only, and does not constitute a recommendation to buy or sell any stock, and they do not take account of your objectives, or your financial situation. Note that the author's analysis may not factor in the latest price-sensitive company announcements or qualitative material.

