

Key Takeaways
- Strategic growth initiatives in NRUs and RSL could enhance revenue and net margins by capitalizing on high-margin aftermarket services and customer commitments.
- Operational improvements and supply chain flexibility may boost gross and operating margins, driving future revenue and earnings growth.
- Currency volatility and operational inefficiencies could challenge Chart Industries' revenue growth, margins, and capital deployment strategy despite sales increase and order uptick.
Catalysts
About Chart Industries- Engages in the designing, engineering, and manufacturing of process technologies and equipment for the gas and liquid molecules in the United States and internationally.
- Chart Industries expects to see more activity in the Nitrogen Rejection Units (NRU) market, forecasting growth at a 6.3% CAGR from 2025 to 2033, which should positively impact revenue.
- The company has a robust commercial pipeline of opportunities amounting to approximately $24 billion, with $2 billion already in customer commitments. Faster pipeline conversion could significantly boost revenue and earnings.
- Chart's strategic focus includes increasing orders and sales in the Repair Service and Leasing (RSL) segment, aiming for high single-digit to 10% growth, which would enhance net margins given the typically higher margin associated with aftermarket services.
- The potential receipt of Phase 2 orders for the Woodside Louisiana LNG project in 2025, along with the execution of multiple large orders, could drive substantial revenue growth and improve operating margins.
- Chart's emphasis on operational improvements in manufacturing and flexibility in the supply chain is expected to enhance future gross and operating margins, positively affecting earnings.
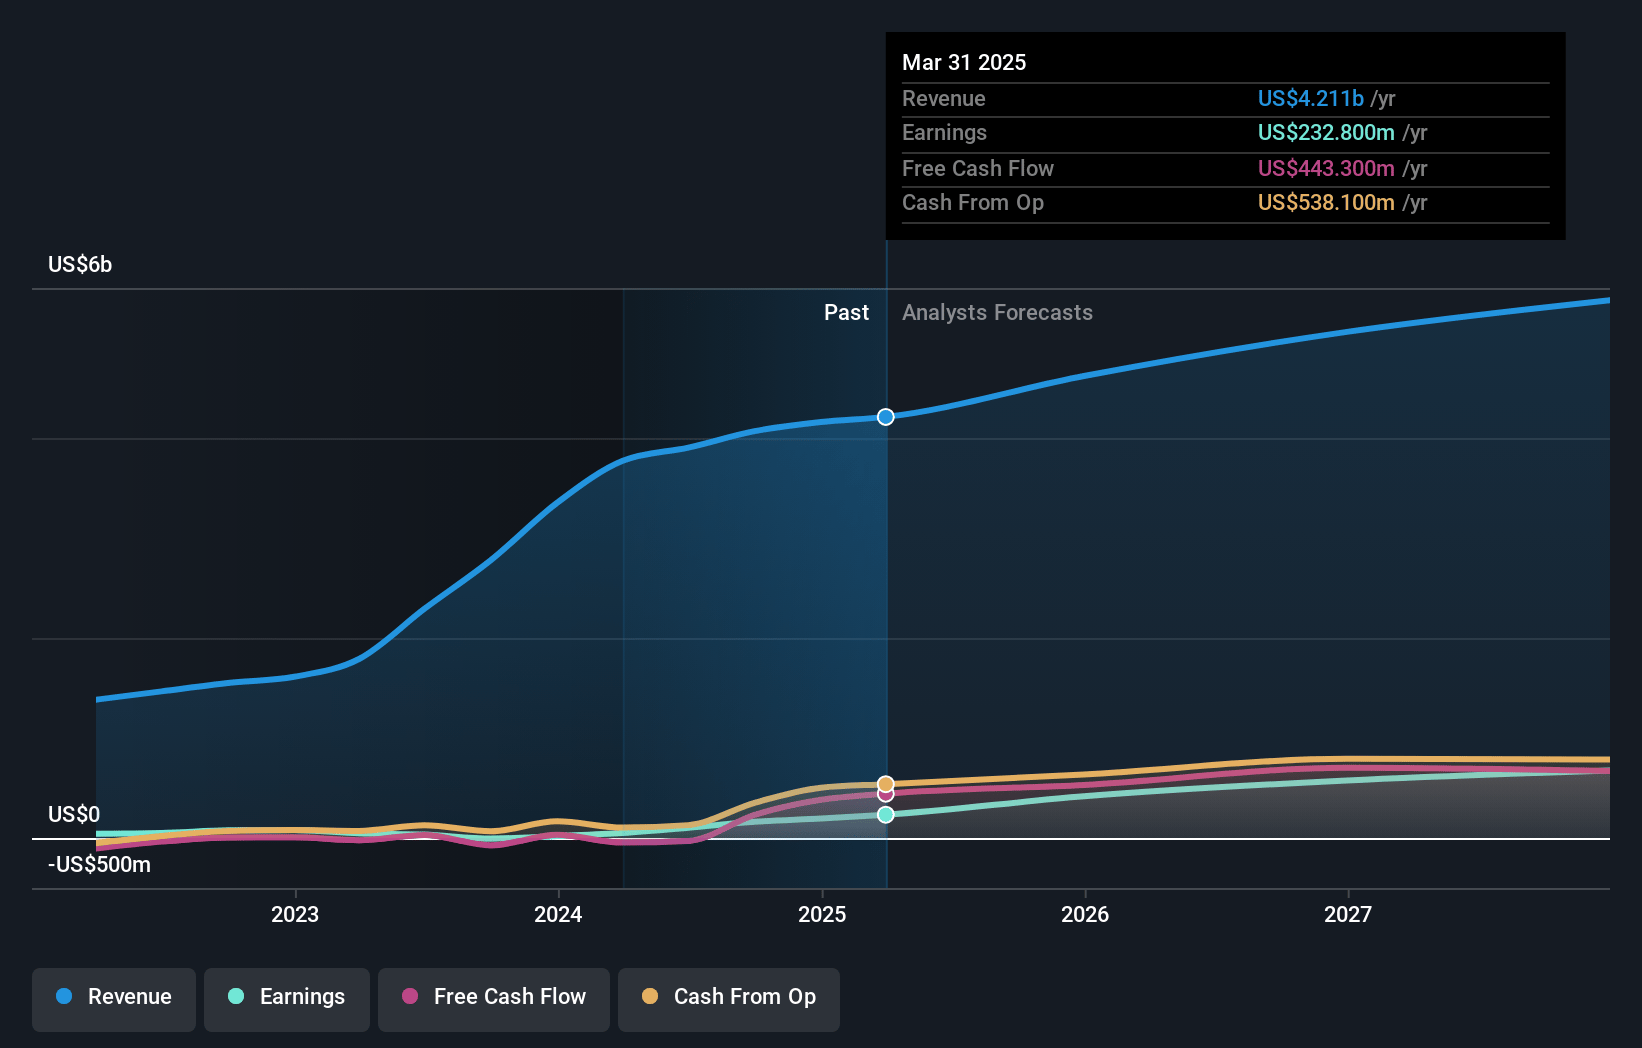
Chart Industries Future Earnings and Revenue Growth
Assumptions
How have these above catalysts been quantified?- Analysts are assuming Chart Industries's revenue will grow by 9.1% annually over the next 3 years.
- Analysts assume that profit margins will increase from 4.7% today to 12.9% in 3 years time.
- Analysts expect earnings to reach $694.0 million (and earnings per share of $14.86) by about April 2028, up from $194.8 million today. However, there is a considerable amount of disagreement amongst the analysts with the most bullish expecting $799.7 million in earnings, and the most bearish expecting $605 million.
- In order for the above numbers to justify the analysts price target, the company would need to trade at a PE ratio of 21.1x on those 2028 earnings, down from 27.9x today. This future PE is greater than the current PE for the US Machinery industry at 19.9x.
- Analysts expect the number of shares outstanding to grow by 6.87% per year for the next 3 years.
- To value all of this in today's terms, we will use a discount rate of 8.57%, as per the Simply Wall St company report.
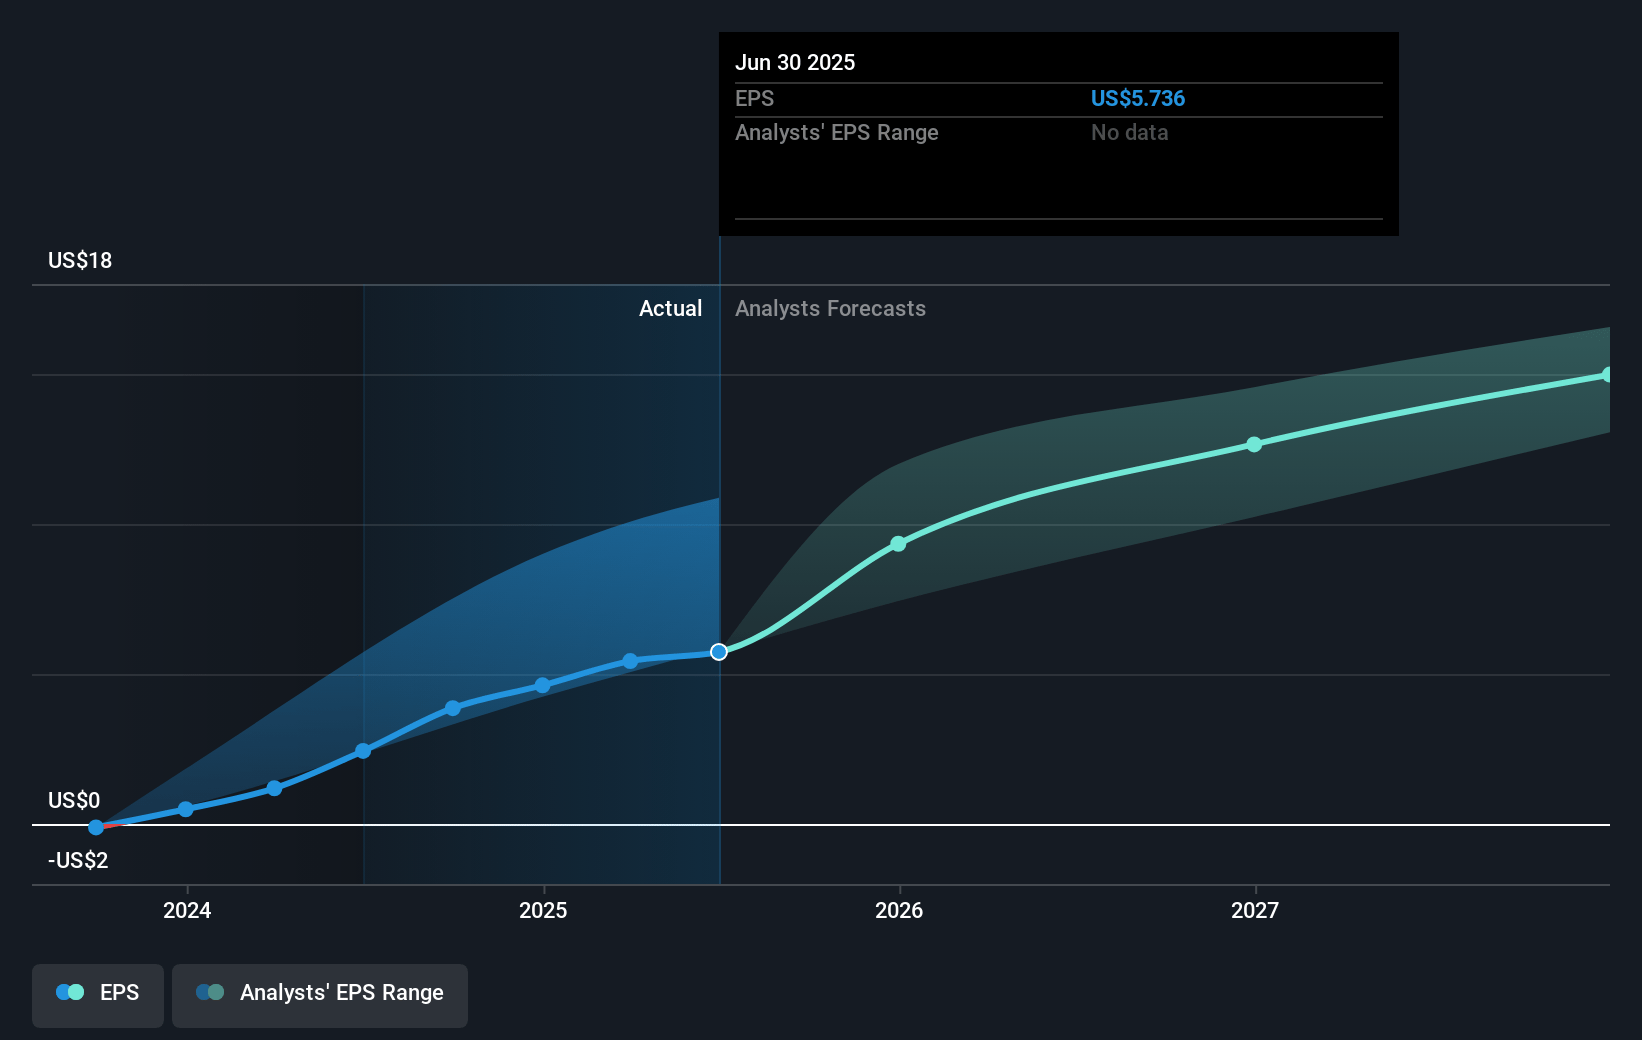
Chart Industries Future Earnings Per Share Growth
Risks
What could happen that would invalidate this narrative?- The company experienced a 17 million headwind from foreign exchange in terms of sales during the fourth quarter, which could continue to impact revenues if currency volatility persists.
- Fourth quarter sales of $1.11 billion increased 10.1%; however, CTS sales decreased by 26.4% when compared to the fourth quarter of '23, indicating potential risks to sustaining current revenue growth rates.
- While there was an increase in orders, the full year 2024 free cash flow came in lower due to factors like taxes, change in share count, foreign exchange, and interest expenses, potentially impacting earnings and investor returns.
- The company's ability to maintain margins could be challenged by unexpected costs, such as third-party expenses and inefficiencies that were encountered at their Theodore, Alabama facility, affecting future net margins.
- The company has a target net leverage ratio and has refrained from share repurchases or material cash acquisitions until it is met, which could impact earnings growth and deployment of capital for business expansion.
Valuation
How have all the factors above been brought together to estimate a fair value?- The analysts have a consensus price target of $211.955 for Chart Industries based on their expectations of its future earnings growth, profit margins and other risk factors. However, there is a degree of disagreement amongst analysts, with the most bullish reporting a price target of $250.0, and the most bearish reporting a price target of just $160.0.
- In order for you to agree with the analyst's consensus, you'd need to believe that by 2028, revenues will be $5.4 billion, earnings will come to $694.0 million, and it would be trading on a PE ratio of 21.1x, assuming you use a discount rate of 8.6%.
- Given the current share price of $121.06, the analyst price target of $211.95 is 42.9% higher.
- We always encourage you to reach your own conclusions though. So sense check these analyst numbers against your own assumptions and expectations based on your understanding of the business and what you believe is probable.
How well do narratives help inform your perspective?
Disclaimer
Warren A.I. is a tool utilizing a Large Language Model (LLM) that ingests data on consensus price targets, forecasted revenue and earnings figures, as well as the transcripts of earnings calls to produce qualitative analysis. The narratives produced by Warren A.I. are general in nature and are based solely on analyst data and publicly-available material published by the respective companies. These scenarios are not indicative of the company's future performance and are exploratory in nature. Simply Wall St has no position in the company(s) mentioned. Simply Wall St may provide the securities issuer or related entities with website advertising services for a fee, on an arm's length basis. These relationships have no impact on the way we conduct our business, the content we host, or how our content is served to users. The price targets and estimates used are consensus data, and do not constitute a recommendation to buy or sell any stock, and they do not take account of your objectives, or your financial situation. Note that Warren A.I.'s analysis may not factor in the latest price-sensitive company announcements or qualitative material.