
“I believe investors can gain an advantage by studying cycles, understanding their causes, and watching for excesses in one direction that are likely to lead to corrections in the opposite direction.” - Howard Marks
About a year ago we covered Howard Marks’ ‘Sea Change’ memo in which Marks said he believed we may be witnessing a major shift in the investment environment.
After basically four decades of declining (and occasionally near zero interest rates), he believes rates may, on average, be higher going forward.
Marks recently published a follow-up memo unpacking more about rate cycles and their effect on investor behavior. The memo, titled ‘Easy Money’ , is a doozy, at over 7,500 words, but you can also listen to it if you’re more of the audio type.
While we recommend reading/listening to the whole memo, we’re going to cover a few points that stood out to us, and how interest rates (and investors expectations of where they’re going) impact stocks through the 5 criteria on our Snowflake!
🎧 Would you prefer to listen to these insights? You can find the audio version on our Spotify or Apple podcasts!
What Happened in Markets this Week?
Here’s a quick summary of what’s been going on:
-
🇺🇸 US Credit Card and Auto Loan Delinquencies at 10 Year Highs ( Axios )
- Our Take: This is one of the first signs that US consumers may be cracking. However, delinquency rates are still a lot lower than they have been during significant rate hiking cycles. Nevertheless, this trend is something investors will be watching closely.
-
🏈 Disney’s ESPN, Warner Bros. Discovery and Fox are Joining Forces to Launch a Streaming Sports Platform ( CNBC )
- Our take: Sports fans will be pleased to see more streaming sports options coming to the market. It’s estimated that the new service will cost around $40 a month, so its audience may be limited. Despite this being a streaming platform, doesn’t this sound exactly like what a cable company is?
-
🇨🇳 China is Replacing its Top Market Regulator in an Effort to End the Market Rout ( WSJ )
- Our take: We’re not entirely sure you can regulate stock prices out of a bear market. It might be more worthwhile to focus on creating an investor friendly business environment. I t seems China may be forced to move ahead with the proposed RMB 2 Trillion ($278 Billion) rescue package in an attempt to breathe some life into the market.
And some of the key economic data released recently:
- 🇦🇺 Australia’s trade surplus fell to $10.96 billion, but was notably higher than expected.
- 🇦🇺 Australia’s central bank kept rates at 4.35%, as expected.
- 🇩🇪 Germany’s trade surplus increased to $22.2 billion, well ahead of the $17 billion expected.
- 🇺🇸 US ISM Services PMI rose 6% to 53.4, above the expected figure of 51.7, a sign of growing confidence in the economy.
- 🇨🇦 Canada recorded a small trade deficit, compared to the $1.8 billion expected.
Easy Money And Its Consequences
When we mentioned Mark’s Sea Change memo (and quite a few times since) we said investors should consider the prospect of rates remaining higher for longer. That’s still true, but today we are going to focus on some of the other insights Marks shared in his latest ‘Easy Money’ memo.
The Effect of Low Interest Rates
Marks mentioned the following 10 effects of low rates:
- Low interest rates stimulate the economy
- Low interest rates reduce perceived opportunity costs
- Low interest rates lift asset prices
- Low rates enable deals to be financed readily and cheaply
- Low interest rates can lead to financial mismatches
- Low interest rates encourage greater use of leverage, increasing fragility
- Low interest rates encourage risk taking, leading to potentially unwise investments
- Low interest rates give rise to expectations of continued low rates
- Low interest rates bestow benefits and penalties, creating winners and losers
- Low rates induce optimistic behavior that lays the groundwork for the next crisis
We’ve changed his order slightly, but the point is:
- The first five are mostly about the maths.
- The second five are about behavior, and are easy to overlook.
The behavior of investors, business leaders, and consumers changes when rates are low - or expected to fall or remain low. This behavior has longer term consequences for the economy and individual companies.
Another Way To Think About Interest Rate Cycles
The biggest question the investment world has right now is: When will the Fed cut rates?
It often seems like central banks are the be-all and end-all of interest rates. Marks reminds us that even without central banks, there would be an interest rate cycle - or more accurately, a credit cycle:
Roughly 30 years ago – largely thanks to my involvement with my partner Bruce Karsh and his distressed debt funds – I became much more conscious of the importance of fluctuations in the availability and cost of money.
The longer I’m involved in investing, the more impressed I am by the power of the credit cycle. It takes only a small fluctuation in the economy to produce a large fluctuation in the availability of credit, with great impact on asset prices and back on the economy itself.
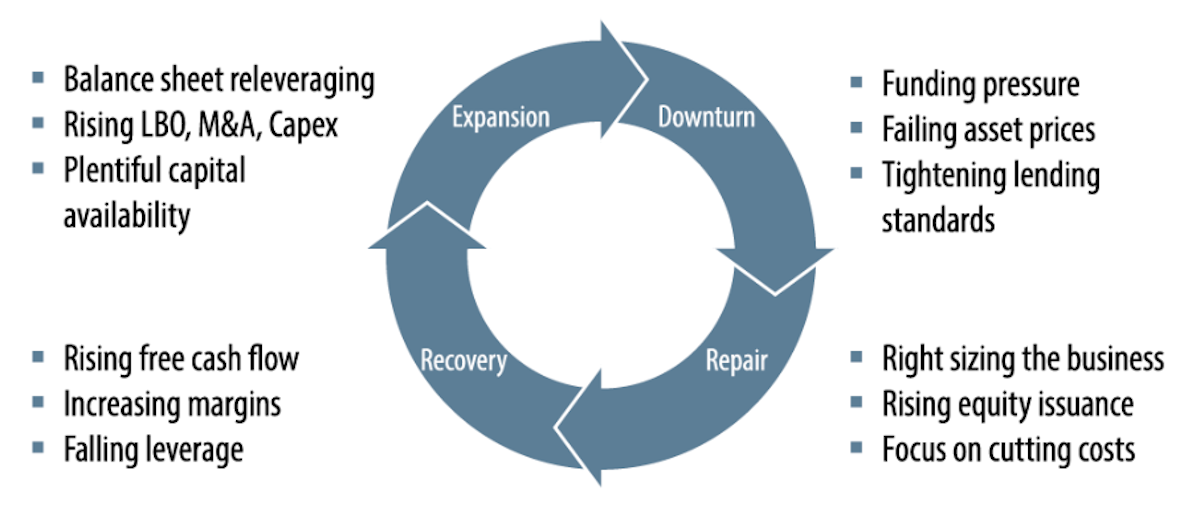
The credit cycle can be easily understood through the metaphor of a window. In short, sometimes it’s open and sometimes it’s closed. And, in fact, people in the financial world make frequent reference to just that: “the credit window,” as in “the place you go to borrow money.” When the window is open, financing is plentiful and easily obtained, and when it’s closed, financing is scarce and hard to get.
This cycle would exist without central banks - though there might be bigger booms and busts.
✨ When rates are low, lenders and investors are forced to take on more risk to earn a return. This leads to higher asset prices and more investment - but eventually reality catches up, leading to a scarcity of credit - and higher rates, which is the price of that credit.
Besides paying attention to what central banks are doing, investors should think about cycles and the potential consequences of decisions made at each stage of the cycle.
Right now, the market appears to believe rates will soon fall. That means investors are acting as though they will - regardless of whether that turns out to be true. Our Insight later on explains why this is potentially dangerous thinking.
Central Banks Have Multiple Mandates
The primary role of central banks is to keep prices stable - ie. in most cases keeping inflation at a target rate of ~2%. The reality is that central banks also try to prevent recessions, stimulate growth and employment, and save the economy from crises. The more they try to achieve with low rates, the more unforeseen consequences can result.
In Marks’ words:
If I ran the Fed (to be clear, I don’t expect to be offered the job), I think I would:
(a) lower rates to stimulate the economy when it’s growing too slowly to produce needed jobs;
(b) raise rates to cool off the economy when it’s overheating, to head off rising inflation; and
(c) keep my hands off rates the rest of time, allowing market forces to determine their level.
Most investors don’t expect rates to fall back to zero unless there is a major financial crisis or a severe recession.
But if that does happen, we might end up with a whole bunch of easy money decision-making again. Read: More money chasing scarce goods.
Are Current Rates High?
Interest rates currently seem to be high - but it’s all relative. Historically rates have been spent a lot more time between 4 and 8% than below 4% as the following chart illustrates:
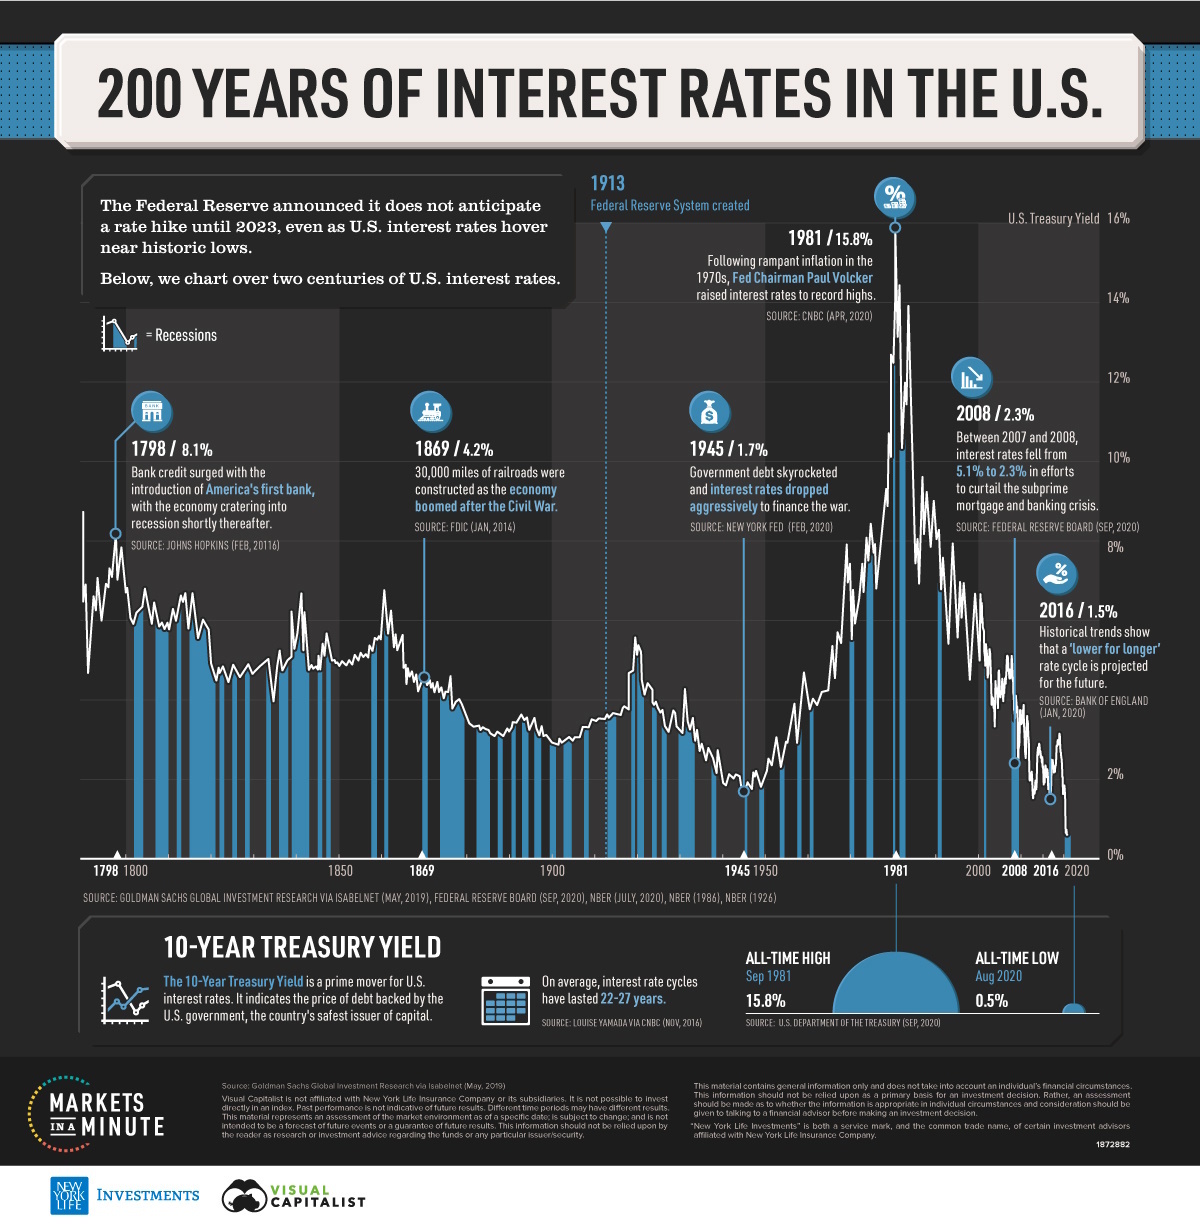
When Marks started working in the investment business in 1969, the Fed Funds rate averaged 8.2%. Over the next 20 years, it ranged from 4% to 20%, so unlike people who have only been in the investing game in the 21st century, he doesn’t consider today’s 5.25 - 5.50% rates high.
And between 1990 and 2000, the last period he considers “normal” for rates, it ranged from 3% to 8%, suggesting a median of 5.25 - 5.50%, in line with today’s rates.
All this is to say no, today’s current rates aren’t high by historical standards.
How Do Rate Cycles Affect Stocks?
We are going to consider the effect of rate cycles on share valuations and company performance. We will do this through the lens of the five categories that make up a snowflake on Simply Wall St company reports.
So first a quick primer on the Simply Wall St snowflake graphics, in case you aren’t up to speed.
You’ll find a snowflake at the top right of every company report on the Simply Wall St platform. The one below is for Microsoft:
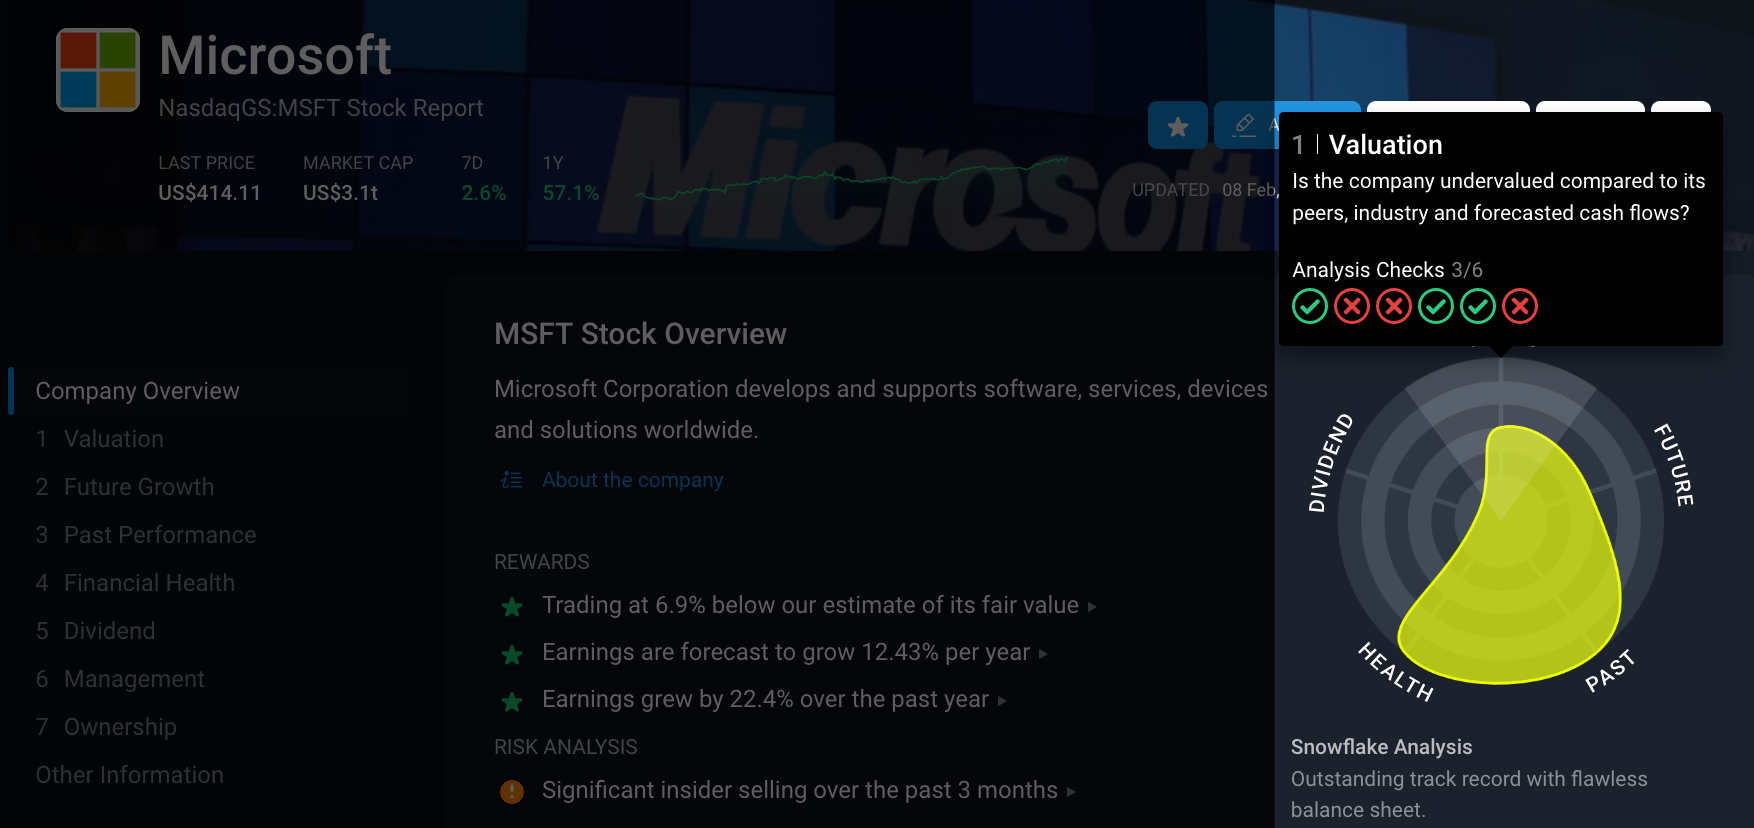
Each Simply Wall St company report includes six checks within each of the following categories:
- Valuation,
- Future growth,
- Past performance,
- Financial health, and
- Dividend payments .
That’s six checks in each of five categories, or 30 checks in total.
The snowflake is simply a graphical representation of those 30 checks in one image. If a company passes every check for a category, it reaches the outer edge of that segment of the circle.
When you look at the whole snowflake, the shape tells you about the company’s strengths and weaknesses, and the color tells you about the overall score.
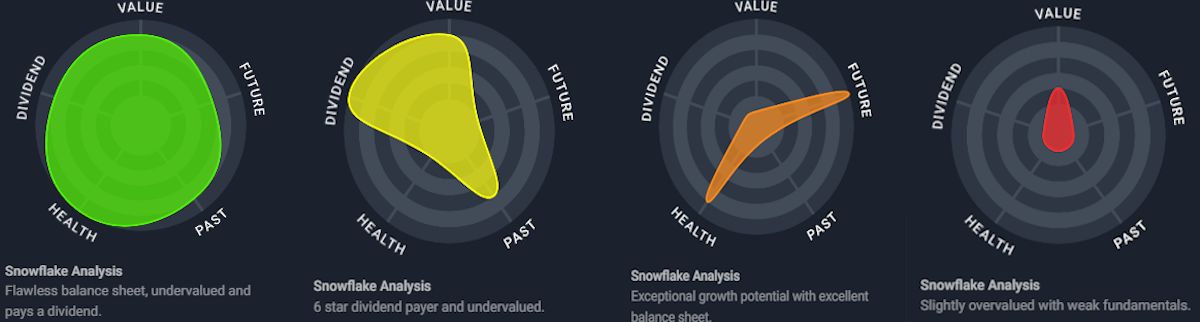
- Green means it passes most of the checks,
- Red means it fails most of the checks, and
- Yellow or orange fall in between and typically means the company is strong in one or two categories, but weak in the others.
Like snowflakes (the real ones), every company is different. Consider the following four companies which have snowflakes with very different shapes and colors.
From left to right:
- Argan is strong across all five categories, but future growth is a little weaker at 4/6.
- Simon Property Group has a 5.3% dividend yield and appears to be offering value. But, its balance sheet and future growth is concerning, so it might struggle to keep paying that dividend.
- MongoDB has outstanding growth prospects and a strong balance sheet. But it's also overvalued and financial performance has been poor.
- WeWork is a disaster across the board with a total score of 2/30. In fact it has been delisted from the NYSE and is only trading OTC.
Does this mean green snowflakes are a buy and red ones are a sell?
Nope. Let’s look at what the snowflake is and isn’t:
What a snowflake is :
- ✅ A summary of publicly available company data combined with analyst forecasts.
- ✅ A quick way to get a sense of the type of company you are dealing with and identify the potential weak points.
- ✅ A tool to speed up the process of finding and filtering potential investments.
- ✅ A great way to compare companies on the fly. You’ll find snowflakes on the screener, watchlists, portfolios and collections so you can see what their relative strengths and weaknesses are.
What a snowflake is not :
- ❌ A buy, sell or hold recommendation.
- ❌ A substitute for fundamental research.
- ❌ An indicator that tells you everything you need to know about a stock.
While appealing investment opportunities are possible with any type of snowflake, greener snowflakes typically indicate stronger businesses, while red ones typically indicate weaker businesses.
There are tens of thousands of companies that you could invest in, and you can’t possibly go through the company reports for all of them.
- The snowflake is step one,
- The company report is step two.
- Step three is finding the qualitative information that completes the picture:
- Competitive advantages, management quality, industry trends, products, IP, etc.
Okay, so now back to interest rates cycles, which we will consider through the lens of the five categories that make up the snowflake:
💰 Valuation
- Interest rates affect the present value of futures cash flows - which is ultimately what you are buying when you invest in a share of a business.
- The further into the future cash flows will be generated, the more they need to be discounted, and the higher the interest rates also mean they need to be discounted more.
- The current share price will discount the market’s expectations for rates in the future.
- So if those expectations are incorrect or change, the share price will need to adjust accordingly.
📈 Future Growth
- Interest rates dictate the price the company and its customers will have to pay to borrow money.
- Future spending by the company (and its customers) will also be affected by their expectations for the direction of rates at any given time.
- If consumers are lowering their spending due to rising rate expectations, then certain businesses future revenues could decline as a result.
- If businesses are cutting back on their operating expenses (day-to-day), then profit margins may increase, but they may be offset IF the company has a higher interest expense (for those that have debt).
- If a business reduces its capital expenses (big investments), their future revenues may grow at a slower rate because they’re not reinvesting as heavily.
🗃️ Past Performance
- A company’s past performance needs to be viewed against the interest rate environment.
- If a company benefited from easy money, things might not be as easy in the future.
- However, if a company manages to generate a return when rates are higher, it may be able to do even better when they fall.
🩺 Financial Health
- If a company has debt, its ability to service and refinance that debt will depend on interest rates .
- Bad decisions made during a period of easy money can lead to problems later on.
- But higher rates also force companies to fix past mistakes and make better decisions.
- These companies can emerge leaner and stronger - if they survive.
💸 Dividend Payments
- Higher rates mean dividends are less attractive than bonds and savings accounts.
- E.g. If purely yield is your goal, why take on equity risk to get a 3% dividend yield if a savings account or bond can pay you 4 or 5%?
- If a company uses debt, it needs to be able to pay the interest on that debt and keep paying the dividend.
- Companies are usually very reluctant to cut their dividend - but taking on more debt to pay a dividend is one of those bad decisions that get made during periods of easy money from management teams with short term incentives. Keep an eye out for high payout ratios (section 5.3 and 5.4).
💡 The Insight: Consensus Could Be Wrong Yet Again
Marks’ ended the memo by pointing out that consensus has been dead wrong over the last 18 months.
First the Fed was going to cause a recession (wrong), then the Fed was going to pivot and be forced to cut aggressively (wrong again). And then, after he published the memo, the expected March rate cut became very unlikely too.
He pointed out that the current consensus view about inflation getting to 2%, no more rate hikes, and a soft landing could just as easily be wrong. If that ends up being the case, that reality will need to be accounted for in share prices, which it currently isn’t.
Here’s a chart from a great article by The Economist to really drive home that point.
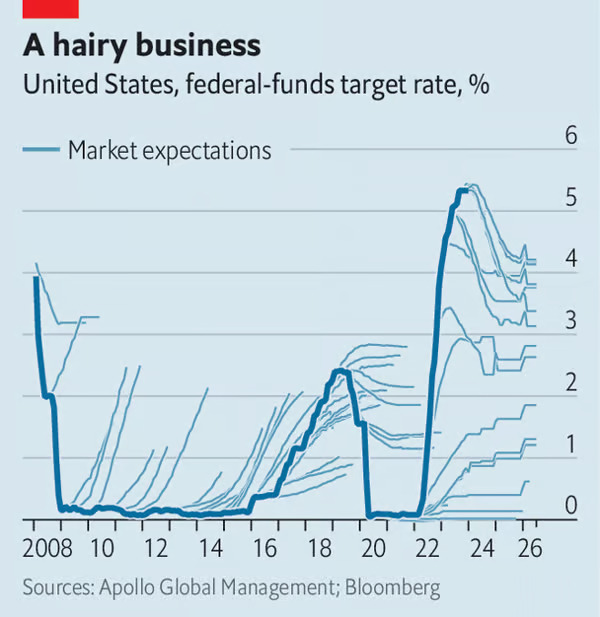
You can see the actual Fed funds rate (thick blue line), and what investors expectations (in aggregate) were at different points in time and how much they differed from what actually happened.
✨ Morale of the story? Don’t rely on interest rate forecasts. ✨
Key Events During the Next Week
Monday
- 🇦🇺 Australia’s Westpac Consumer Confidence Index will be published. It’s expected to be better than the prior level of -1.3%, but remain in negative territory at -0.8%. Read: Less pessimistic.
Tuesday
-
🇬🇧 The UK’s latest unemployment rate is expected to rise from 3.9% to 4%.
-
🇺🇸 The consumer inflation data will be published in the US. Headline inflation is expected to remain at 3.4%.
Wednesday
-
🇯🇵 Japan’s GDP growth rate will be announced. Economists expect it to swing to 0.4% from the prior -0.7%
-
🇬🇧 In the UK, inflation, retail sales and manufacturing production data is expected.
-
Manufacturing Production is expected to fall slightly, from 1.3% to 1.1%.
-
Retail sales are forecast to rise 1.2% after falling 3.2%.
-
Thursday
- 🇬🇧 UK GDP is expected to be flat after previously contracting by 0.1%.
- 🇺🇸 US retail sales are expected to be up 0.2% month on month, down from 0.6% for the prior period.
Friday
- 🇺🇸 US producer prices are forecast to rise 0.1% after declining in December.
- 🇺🇸 US Housing starts are forecast to be flat at 1.47 million.
We are about halfway through earnings season and on to smaller companies. Some of the bigger ones due to report this week include:
- Coca-Cola
- Cisco
- Applied Materials
- Deere and Company
- Shopify
- Airbnb
- Arista Networks
- Cadence Design Systems
- Moody’s Corporation
- Occidental Petroleum
- DoorDash
- Datadog
Have feedback on this article? Concerned about the content? Get in touch with us directly. Alternatively, email editorial-team@simplywallst.com
Simply Wall St analyst Richard Bowman and Simply Wall St have no position in any of the companies mentioned. This article is general in nature. We provide commentary based on historical data and analyst forecasts only using an unbiased methodology and our articles are not intended to be financial advice. It does not constitute a recommendation to buy or sell any stock and does not take account of your objectives, or your financial situation. We aim to bring you long-term focused analysis driven by fundamental data. Note that our analysis may not factor in the latest price-sensitive company announcements or qualitative material.
Richard Bowman
Richard is an analyst, writer and investor based in Cape Town, South Africa. He has written for several online investment publications and continues to do so. Richard is fascinated by economics, financial markets and behavioral finance. He is also passionate about tools and content that make investing accessible to everyone.