
What Happened In The Market This Week?
Market Insight for 6th June - 13th June 2022
Global markets are consolidating after two week of gains. Energy stocks have outperformed as they track the oil price higher, in contrast to stocks in the financials and consumer staples sectors which are slightly lower. The other remaining sectors posted small gains.
These are some of the issues and developments we are watching:
- The S&P 500 P/E ratio looks attractive when compared to its historical range — but that may change if earnings estimates fall.
- Crude oil prices have continued to rise despite OPEC’s decision to increase output as demand remains strong while supply problems persist.
- The World Bank has warned of potential stagflation as inflation remains high while several countries are likely to slip into a recession.
S&P 500 Might Look Cheap, But Lower Future Earnings Could Remove the Appeal
Most of the companies in the S&P 500 index have reported their financial results for the first quarter. As it stands, analysts are still expecting EPS of about $229 for the index for the full year (2022). This figure is the weighted sum of the consensus EPS forecasts for each of the 500 companies in the index.
With the index at around 4140, and the EPS estimate at $229, the forward price earnings (P/E) ratio - calculated as the price level of the S&P 500 divided by the EPS estimate - is approximately 18x (having reached a low of 16.6x in May). So, how does this compare to historical levels? The following chart reflects the S&P 500’s P/E ratio (based on historical EPS) going back to 1928, along with the current forward P/E of 18x.
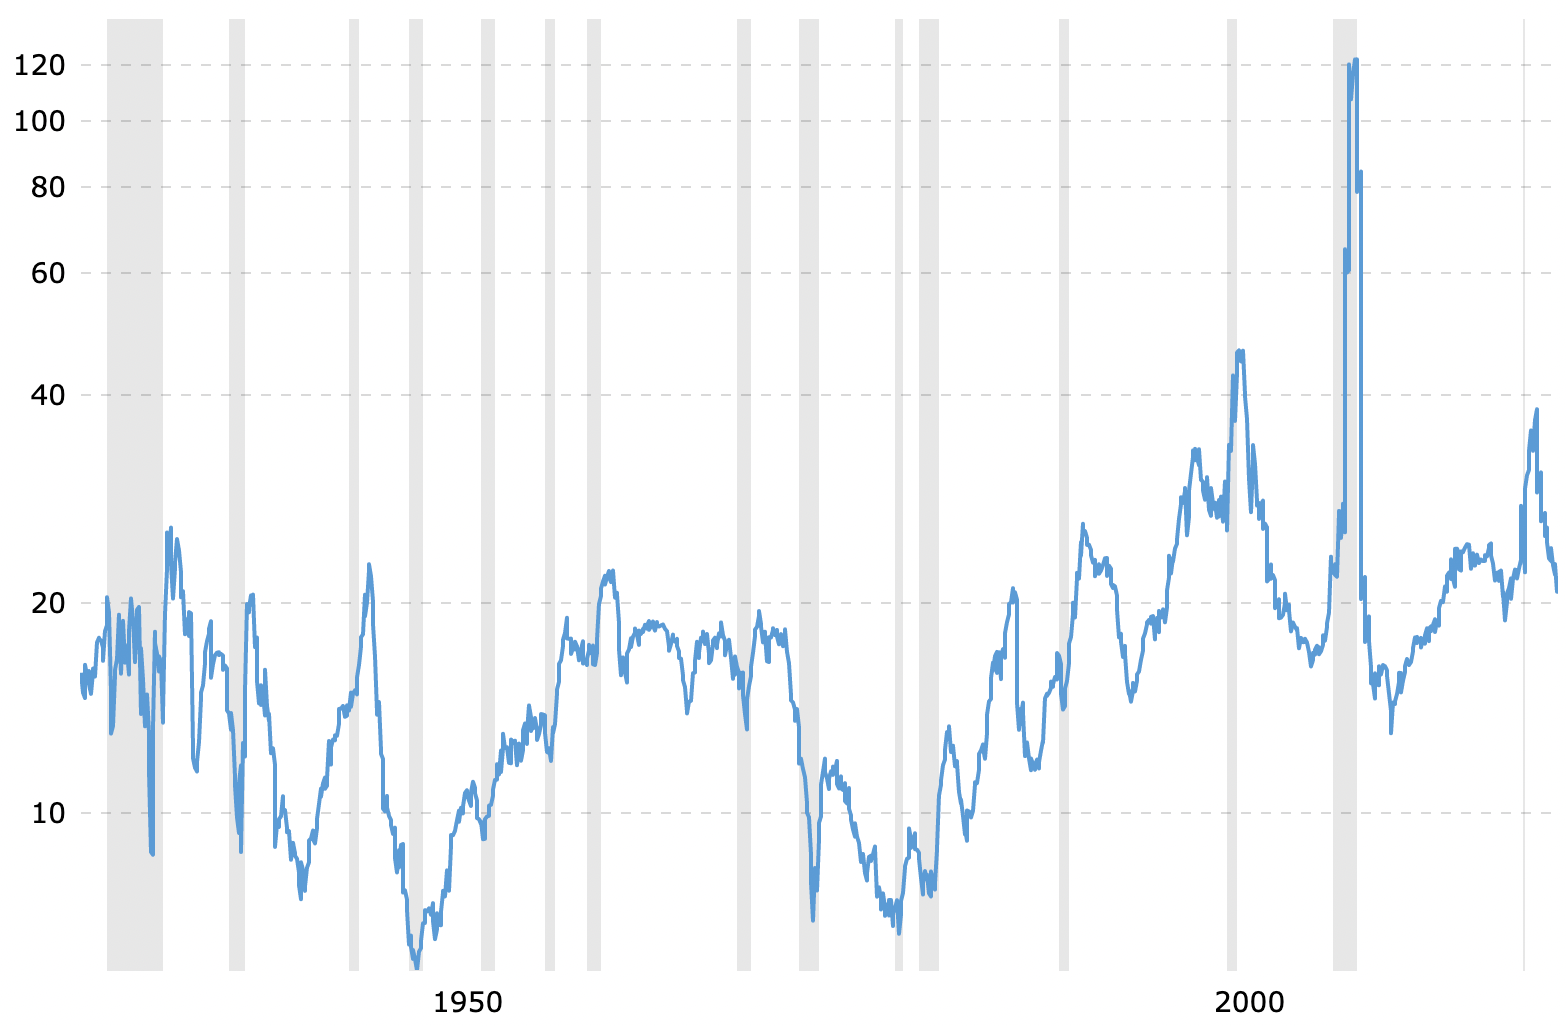
Historical S&P 500 P/E ratio 1928 to 2022 Source: Macrotrends.net
The chart shows that today’s forward P/E ratio of 18x is low, relative to its range going back to 1990. However, this assumes earnings estimates don’t fall, and this will be a key factor to watch over the next few quarters. It is important to recall that the forward P/E ratio of the S&P 500 goes up when either its price goes up or the EPS estimates go down (because EPS is the denominator of the P/E ratio), and that forward P/E would go down if either the S&P 500 goes down or EPS forecasts go up.
While analysts have been reducing their EPS forecasts for the second quarter, they have actually raised their forecasts for the third and fourth quarters . This means that as it stands, earnings estimates for the full year have remained flat.
The situation could of course change after the next round of earnings reports, or in response to new economic data. A recession would typically lead to lower quarterly earnings — but a recession isn’t certain.
The Insight: The P/E ratio on the S&P 500 (and on most stocks) has fallen because stock prices have fallen. It now looks attractive relative to its range over the last 30 years because it’s based on past earnings, but it may not be as ‘cheap’ as it seems, if earnings for the third and fourth quarter end up being lower. If earnings do go lower in the coming quarters and don’t show much sign of future growth, then stock prices may fall further.
Crude Oil Prices Continue to Rise Despite OPEC Decision to Increase Production
Last week, OPEC agreed to increase crude oil output by 648,000 barrels a day in July , which is 50% more than what was expected. Despite the increase in expected production, the oil price has continued to rise. The July futures contract for US crude oil has risen from $116.87 to $122.60 over the last week.
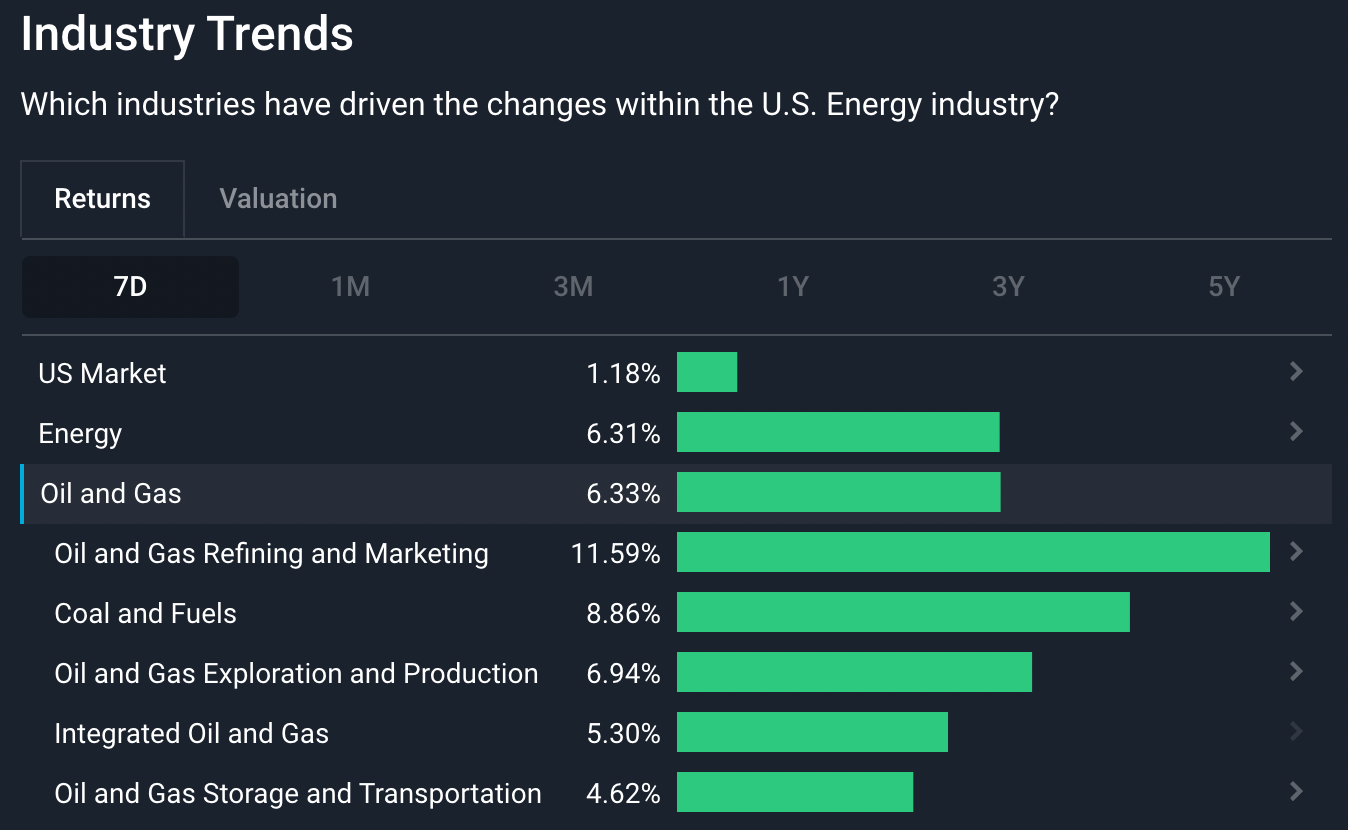
US Oil and Gas Industry 7-Day Performance - Simply Wall St
OPEC (the Organization of the Petroleum Exporting Countries), which consists of 13 oil-producing countries in the Middle East and Africa, along with Venezuela in South America, accounts for around 44% of global oil production. OPEC members coordinate their production targets to optimize profitability. Their goal is to maximize the oil price without making it so unaffordable that demand evaporates.
So, why is the oil price still rising despite an expected increase in production? There are several reasons contributing to the current rally:
- The spot price of oil (the price of physical oil rather than oil futures) is very sensitive to current supply and demand , while the increased output only comes into effect in July.
- China has eased some lockdown measures in Beijing and Shanghai , leading to increased demand.
- There is some speculation that most OPEC members are already operating at maximum capacity and it may take some time to increase that capacity.
- The pandemic severely disrupted the supply chain for oil, and these disruptions continue.
- European countries are under pressure to reduce their dependence on Russian oil and gas.
The Insight: Increasing oil production may take some upward pressure off the oil price, but there are several other factors throttling supply, while demand remains high. Given the uncertainty and challenges, the oil price may remain volatile for some time. That said, if the price of oil does rise even further, demand for it typically starts to reduce as consumer’s elect to travel less or avoid energy intensive goods and services.
One of our analysts recently put together a list of some of the companies benefitting from the rising oil price .
World Bank Warns of Potential Stagflation on the Horizon
The World Bank has reduced its forecast for global GDP growth for 2022 to 2.9% from 5.7%. For individual countries, 2.9% is a long way from a recession - but if 2.9% is the global average, quite a few countries will probably experience a recession. The World Bank also warned that the global economy may slip into a period of stagflation similar to the 1970s.
Managing an economy is a trade-off between growth and inflation. Typically, you’d expect occasional periods of higher inflation as a byproduct of economic growth, and central banks sometimes need to reign-in growth by raising interest rates. However this inflation we’re seeing is currently in a low growth environment, which, as we mentioned in last week’s update , is incredibly complex for policy makers to navigate. This low economic growth and persistent inflation is known as Stagflation, and it's the worst of both worlds.
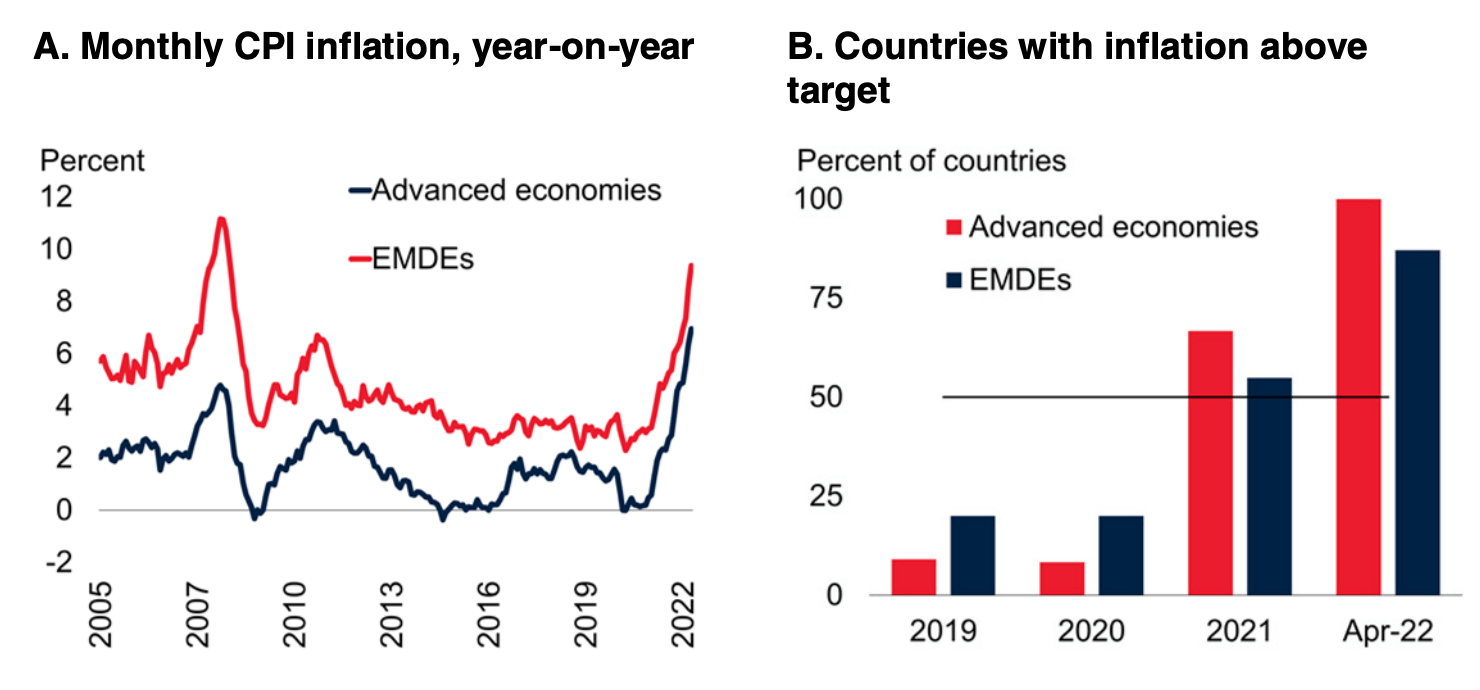
Inflation figures from Advanced Economies and Emerging Markets and Developing Economies - Global Economic Prospects Report - June 2022
*EMDE = Emerging Markets and Developing Economies
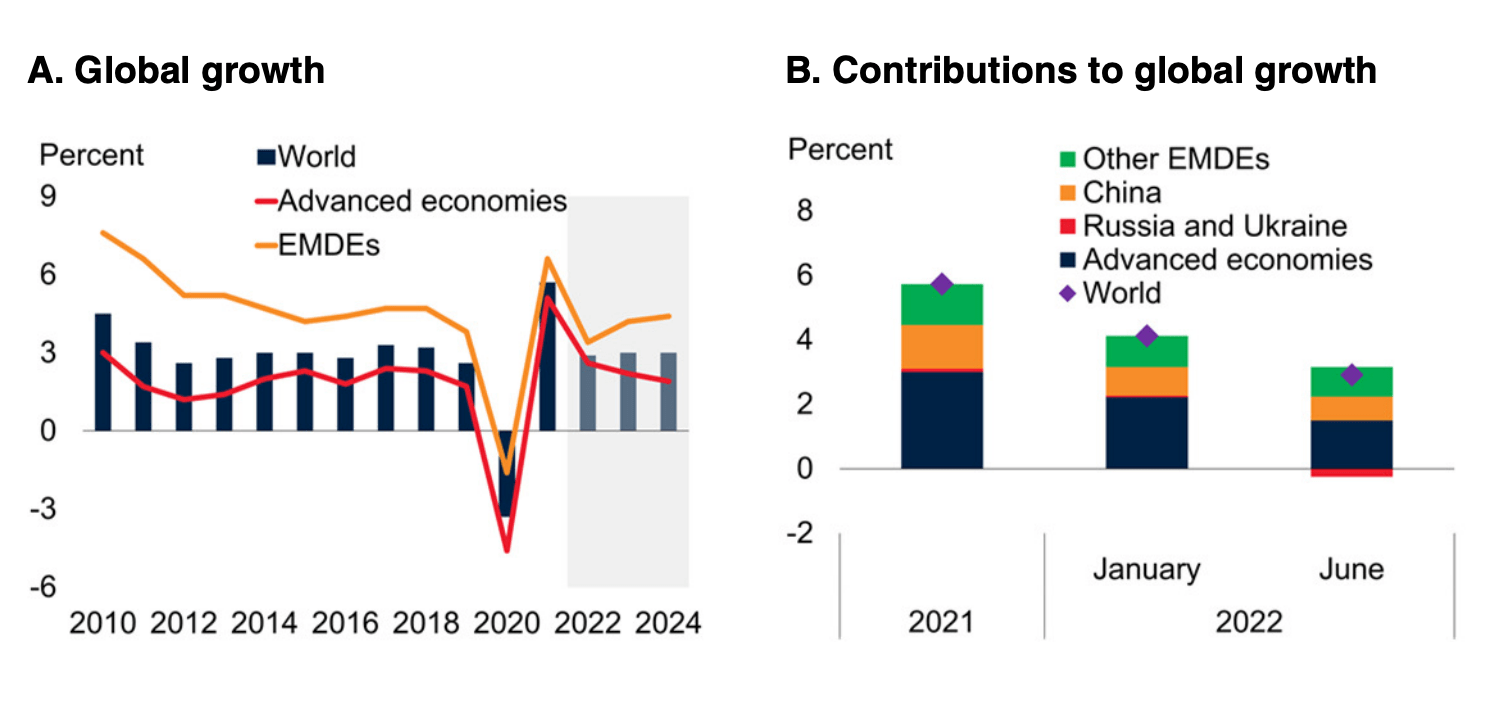
Global Growth and Forecasts - Global Economic Prospects Report - June 2022
*EMDE = Emerging Markets and Developing Economies
As an example, during the 1970s, an oil price shock resulted in rising inflation and economic stagnation around the world. To end the cycle of inflation, central banks had to aggressively raise interest rates over several years.
If you want to do some light reading on your weekend, the June 2022 Global Economics Prospects report from the World Bank that we’ve cited above is a dense 176 page document, outlining everything from the evolution of inflation to the policy options for emerging markets in the current environment.
The Insight: Stagflation often results in rising unemployment, while prices also continue to rise. This is particularly hard for consumers who don’t have savings to fall back on, and for the companies that sell to those consumers. In last week's update we covered the 12-year low savings rate of 4.4%, and how this would impact consumer discretionary businesses. It also affects emerging economies that depend on global growth for their exports.
Market Outlook Next Week
As expected, Australia’s central bank raised rates by 0.5% last week. This week, the U.K. , the U.S. and Japan will be announcing interest rates. The U.S. Fed Funds Rate announcement and press conference on Wednesday will be keenly watched by investors and analysts alike.
The other key data from the U.S. this week will be on producer price inflation (PPI), retail sales levels and initial jobless claims. The UK will be releasing GDP and manufacturing data, and the latest unemployment rate. In Australia, the NAB Business Confidence index is published on Tuesday and the unemployment rate on Thursday.
We are into the tail end of a first quarter earnings season. There are just a few U.S. companies and several non-US companies reporting first quarter results. The notable companies reporting include:
- Adobe ( NasdaqGS:ADBE )
- Kroger ( NYSE:KR )
- Glencore Plc ( LSE:GLEN )
- Nestle ( SWX:NESN )
Until next week,
Invest Well,
Simply Wall St
Have feedback on this article? Concerned about the content? Get in touch with us directly. Alternatively, email editorial-team@simplywallst.com
Simply Wall St analyst Richard Bowman and Simply Wall St have no position in any of the companies mentioned. This article is general in nature. We provide commentary based on historical data and analyst forecasts only using an unbiased methodology and our articles are not intended to be financial advice. It does not constitute a recommendation to buy or sell any stock and does not take account of your objectives, or your financial situation. We aim to bring you long-term focused analysis driven by fundamental data. Note that our analysis may not factor in the latest price-sensitive company announcements or qualitative material.
Richard Bowman
Richard is an analyst, writer and investor based in Cape Town, South Africa. He has written for several online investment publications and continues to do so. Richard is fascinated by economics, financial markets and behavioral finance. He is also passionate about tools and content that make investing accessible to everyone.

