
What Happened In The Market Last Week?
🎧 Prefer to listen to these insights? Check out the audio recording on our Spotify!
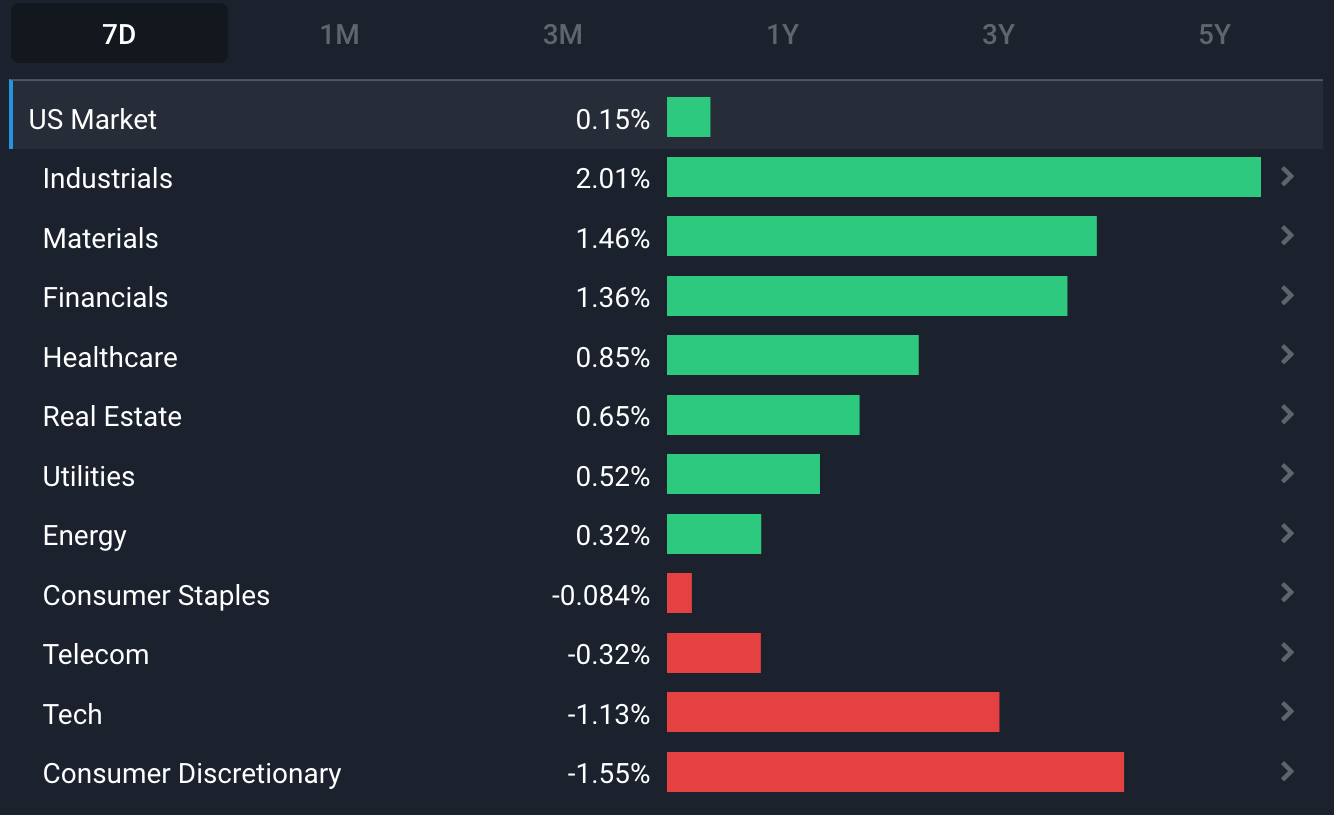
A rally in equity markets early last week stalled when it emerged that the Fed expects the banking crisis to lead to a recession in the US later this year. Growth stocks fell and pulled the US Telecom , Tech and Consumer discretionary sectors down with them. Gold stocks were the big winners as the gold price held above $2,000. US Materials and Energy stocks also tracked commodity prices higher.
Some of the developments we have been watching over the last week include:
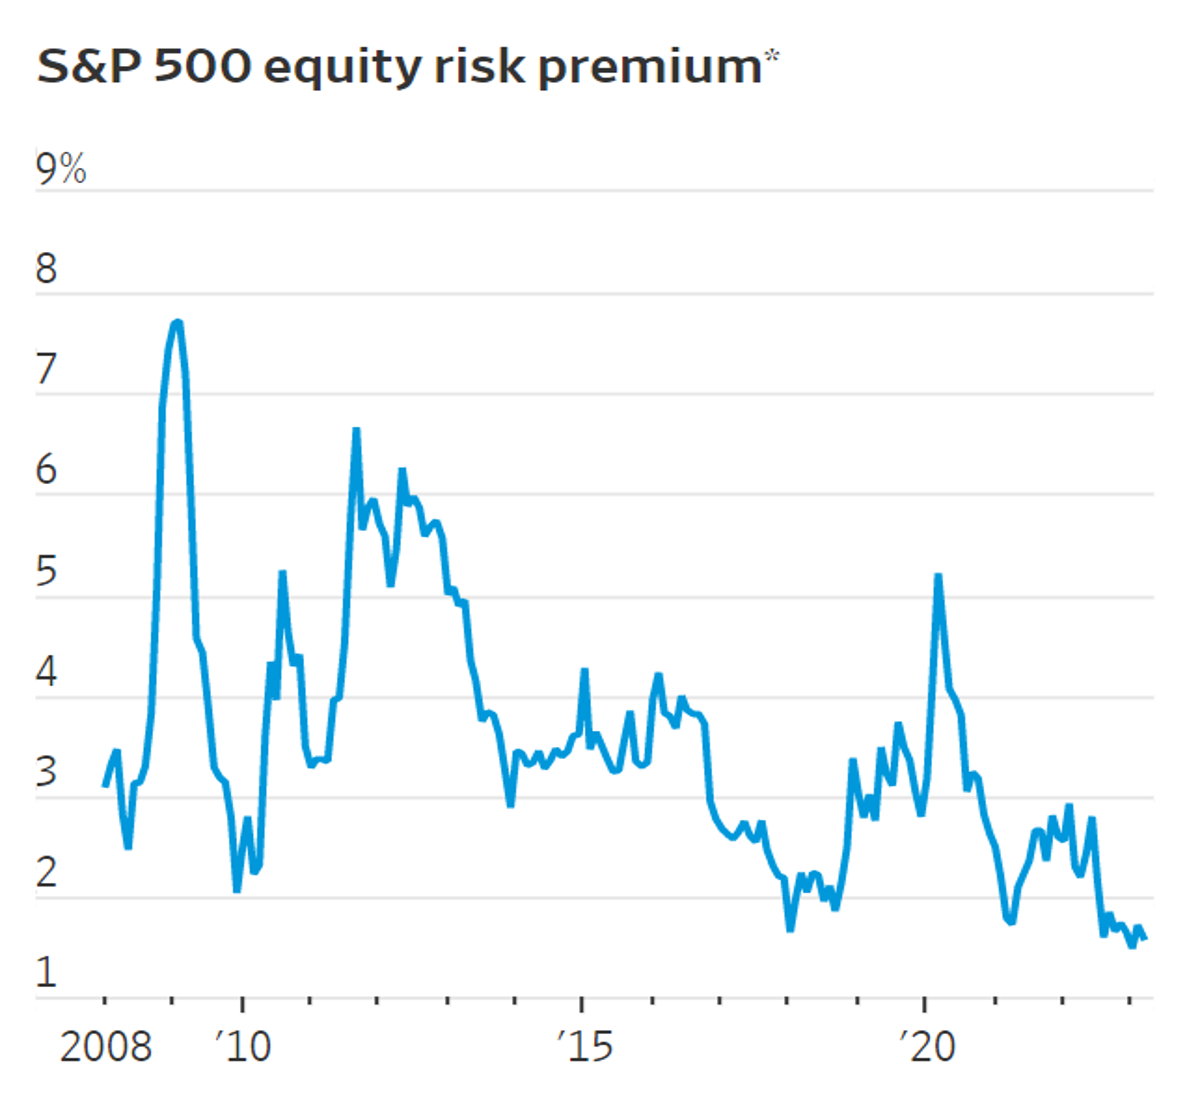
- Equities don’t look that compelling compared bonds as the equity risk premium for the S&P 500 index has fallen to a 15-year low , driven by stalled earnings growth and rising bond yields.
- The gold price is once again closing in on all-time highs as investors look for safety and the USD weakens.
Equities Have The Same Appeal As 2007 - Which Isn’t Much
A recent article in the Wall Street Journal pointed out that the equity risk premium for US equities is the lowest it's been since 2007 . As of the end of March, it was a piddly 1.59%, less than half its 3.5% average over the last 15 years.
Sooo… buy bonds? Not so fast.
What Is An Equity Risk Premium (ERP)?
The ERP for a stock or index is the earnings yield minus the risk-free rate. What’s the earnings yield you ask? It’s the opposite of a PE ratio, i.e. E arnings / Price, rather than Price / Earnings - picture the quoted rental yield on an investment property.
Now the ERP reflects the premium that investors are paid for holding stocks over bonds. Naturally, if you’re taking on more risk with your investments, you’d expect to be rewarded with higher returns or ‘a premium’.
Hypothetically, would you choose a risk-free 5% return with government bonds or a riskier 9% with equities? Of course, the answer to that depends on your financial goals and risk profile, but in that case, the ERP would be 4% (9% - 5%). Some people would take that because they feel the 4% return premium is adequate compensation for the added risk with equities.
It’s common to compare the ERP for a specific market to its historical average just to get an idea of whether it's potentially overvalued or undervalued.
In the WSJ article, the earnings yield over the last 12 months is being compared to the yield on 10-year government bonds, but the ERP can also be applied on a forward-looking basis (like next year's earnings).
The S&P 500 ERP Isn’t Reflective Of All Markets And Sectors
Given the current level of uncertainty, 1.59% does seem like a low premium to earn compared to the certainty of bond yields. But this number is heavily skewed by some of the large companies in the S&P 500 index, some of which have very low earnings yields for the last 12 months.
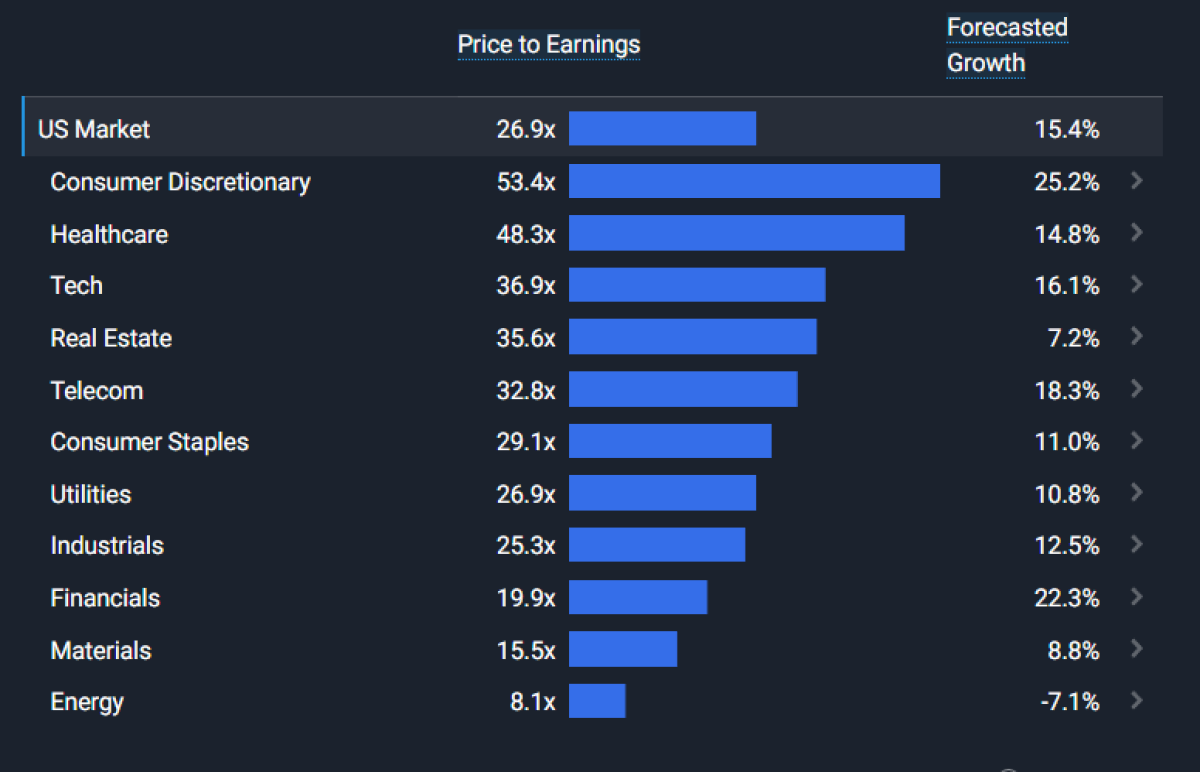
Most other markets have higher premiums (although growth forecasts are lower). And within the US market, there are sectors and industries trading on much lower price multiples. You can view the table below for any market on the Simply Wall St Market Page , and then drill down further to the industry level.
💡 The Insight: Now There Are Alternatives to Equities
For the equity risk premium to rise, one of three things has to happen,
- Either bond yields must fall ,
- The earnings yield must rise , or
- Stock prices must fall .
However, as we pointed out recently, earnings forecasts are still falling . That means the earnings yield on the S&P 500 could fall further. The index may not be reflective of the global market, but global markets do tend to follow the US indices.
The other point to note is that the era of TINA (there is no alternative) is over. When central banks cut rates to zero they forced investors to “go further up the risk curve” and buy equities because fixed-income assets offered virtually no return.
That’s changed now since bonds offer respectable yields (at least in comparison to equities, and if you don’t account for inflation 😅).
What This Means For Investors
Two main takeaways for us investors to this would be:
- Focus on finding individual companies within our circle of competence that we can buy for a fair price , rather than broad market indexes (which can be skewed, as we mentioned).
- Diversification can help reduce our risk if we’re uncertain and don’t have a well-founded conviction about how an asset class or sector is going to perform.
We often say, trying to time the market is a bad idea. But, the market is still trying to work out what the ‘new normal' is, and it’s a good time to be cautious. One of the best ways to be cautious is by diversifying, both by sector and by asset class.
Besides equities and cash, you can hold bonds and commodities via ETFs like the iShares short-term treasury ETF ( Nasdaq: SHY ) or the Invesco Commodity fund ( ARCA: DBC ).
Gold Back Above $2,000
Gold bugs are no doubt stoked about the shiny metal’s performance over the last 6 months.
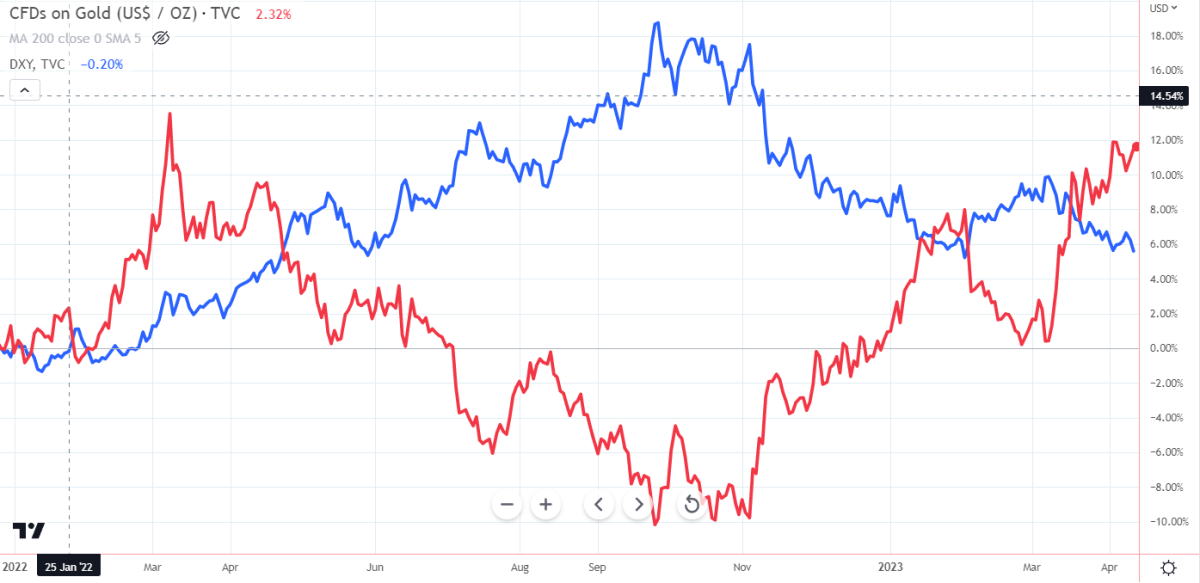
The Gold price is up 10% year to date and 24% since the October low. It crossed $2,000 an ounce in 2020 and again in March last year, but quickly reversed on both occasions. The latest rally has been attributed to market uncertainty and the banking crisis but - as the following chart illustrates - it also has a lot to do with the USD.
Gold is widely regarded as both an inflation hedge and a safe haven so its performance last year was surprising. The price shot up early in the year when inflation began to spike and stock prices began to fall, but then fell soon after interest rates began to rise.
As we mentioned in October, any asset priced in USD will appear weak when the greenback (USD) appreciates so quickly . In addition, rising rates meant leveraged long positions became more expensive to hold, and losses were magnified as the price fell.
The price of gold turned when the USD began to weaken, and risk appetite rose as investors began to anticipate an end to rate hikes. After pulling back in January and February, the price accelerated higher as the banking crisis unfolded in March. The next test is whether or not it can break out to a new high and follow through.
💡 The Insight: Gold Might Not Be As Crowded This Time
While gold is regarded as a safe haven, it can be prone to mini bubbles when too many traders hold speculative longs, particularly if they are using leveraged instruments. When momentum turns, they become forced sellers and the price quickly retraces.
The chart below shows the gold price, with the open futures positions held by non-commercial participants ( blue ), commercial participants ( grey ) and others ( red ).
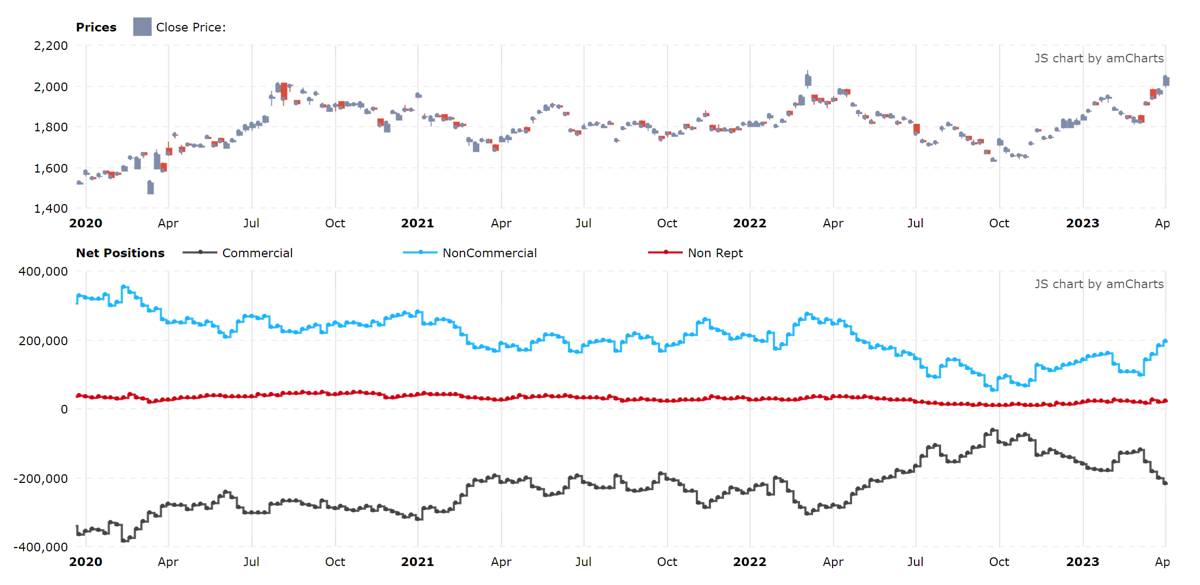
Commercial traders include producers and swaps dealers who trade with producers. These traders generally hold short positions to lock in prices on production. These short positions have increased as the price has risen over the last few months.
The non-commercial participants are for the most part money managers (and regarded as speculative), and they usually hold long positions. While speculative long positions have increased recently, they are still lower than they were in 2020 and 2021. This may indicate that traders are wary after the last two reversals.
Meanwhile, in the ETF world, gold funds had net outflows during the first quarter despite large inflows in March. The bottom line is that gold might not be as over-owned as it was in 2020 and 2022 when the price crossed $2,000.
What This Means For Investors
For an asset like gold that can’t be valued like a stock or a bond, technical levels are as important as anything else (Cue Buffett rolling his eyes).
Those inclined to believe in technical analysis (not us) would say that if gold prices can hold higher than past “resistance” levels at $2,070, then it’s likely to stabilise and continue testing all-time highs. However, if there’s a slight hiccup at these levels, investors will likely take profits on their holdings and the price will begin to fall.
But that depends on if you believe in that stuff or not….
Whether gold will turn out to be a good inflation hedge or investment over the long term remains to be seen. But it has usually been a very effective hedge against market volatility.
For most investors wanting to include gold in their portfolio, the choice is between ETFs that own physical gold, the shares of gold mining companies, or ETFs that hold a portfolio of gold miners. If you do invest in gold miners make sure you understand the company, the resource it mines, whether its production is hedged (which caps the upside but limits the downside) and how well capitalized it is.
Key Events During The Next Week
There are a few data points that investors will be watching this week. On Tuesday, Australia's central bank will release the minutes from the last interest rate policy meeting, and in the US housing data will be published. In the UK there’s employment data out on Tuesday, the inflation rate on Wednesday and retail sales on Friday.
It’s week two of earnings season with the second batch of large banks and the first of the tech companies reporting results for the first quarter. Some of the key companies reporting are:
- Charles Schwab ( Nasdaq:SCHW )
- Bank of America ( NYSE:BAC )
- Goldman Sachs ( NYSE:GS )
- Morgan Stanley ( NYSE:MS )
- Johnson and Johnson ( NYSE:JNJ )
- Proctor and Gamble ( NYSE:PG )
- Netflix ( Nasdaq:NFLX )
- IBM ( NYSE:IBM )
- United Airlines ( NYSE:UAL )
- Taiwan Semiconductor Manufacturing ( NYSE:TSM )
- AT&T ( NYSE:T )
Have feedback on this article? Concerned about the content? Get in touch with us directly. Alternatively, email editorial-team@simplywallst.com
Simply Wall St analyst Richard Bowman and Simply Wall St have no position in any of the companies mentioned. This article is general in nature. We provide commentary based on historical data and analyst forecasts only using an unbiased methodology and our articles are not intended to be financial advice. It does not constitute a recommendation to buy or sell any stock and does not take account of your objectives, or your financial situation. We aim to bring you long-term focused analysis driven by fundamental data. Note that our analysis may not factor in the latest price-sensitive company announcements or qualitative material.
Richard Bowman
Richard is an analyst, writer and investor based in Cape Town, South Africa. He has written for several online investment publications and continues to do so. Richard is fascinated by economics, financial markets and behavioral finance. He is also passionate about tools and content that make investing accessible to everyone.