
What Happened in the Market Last Week?
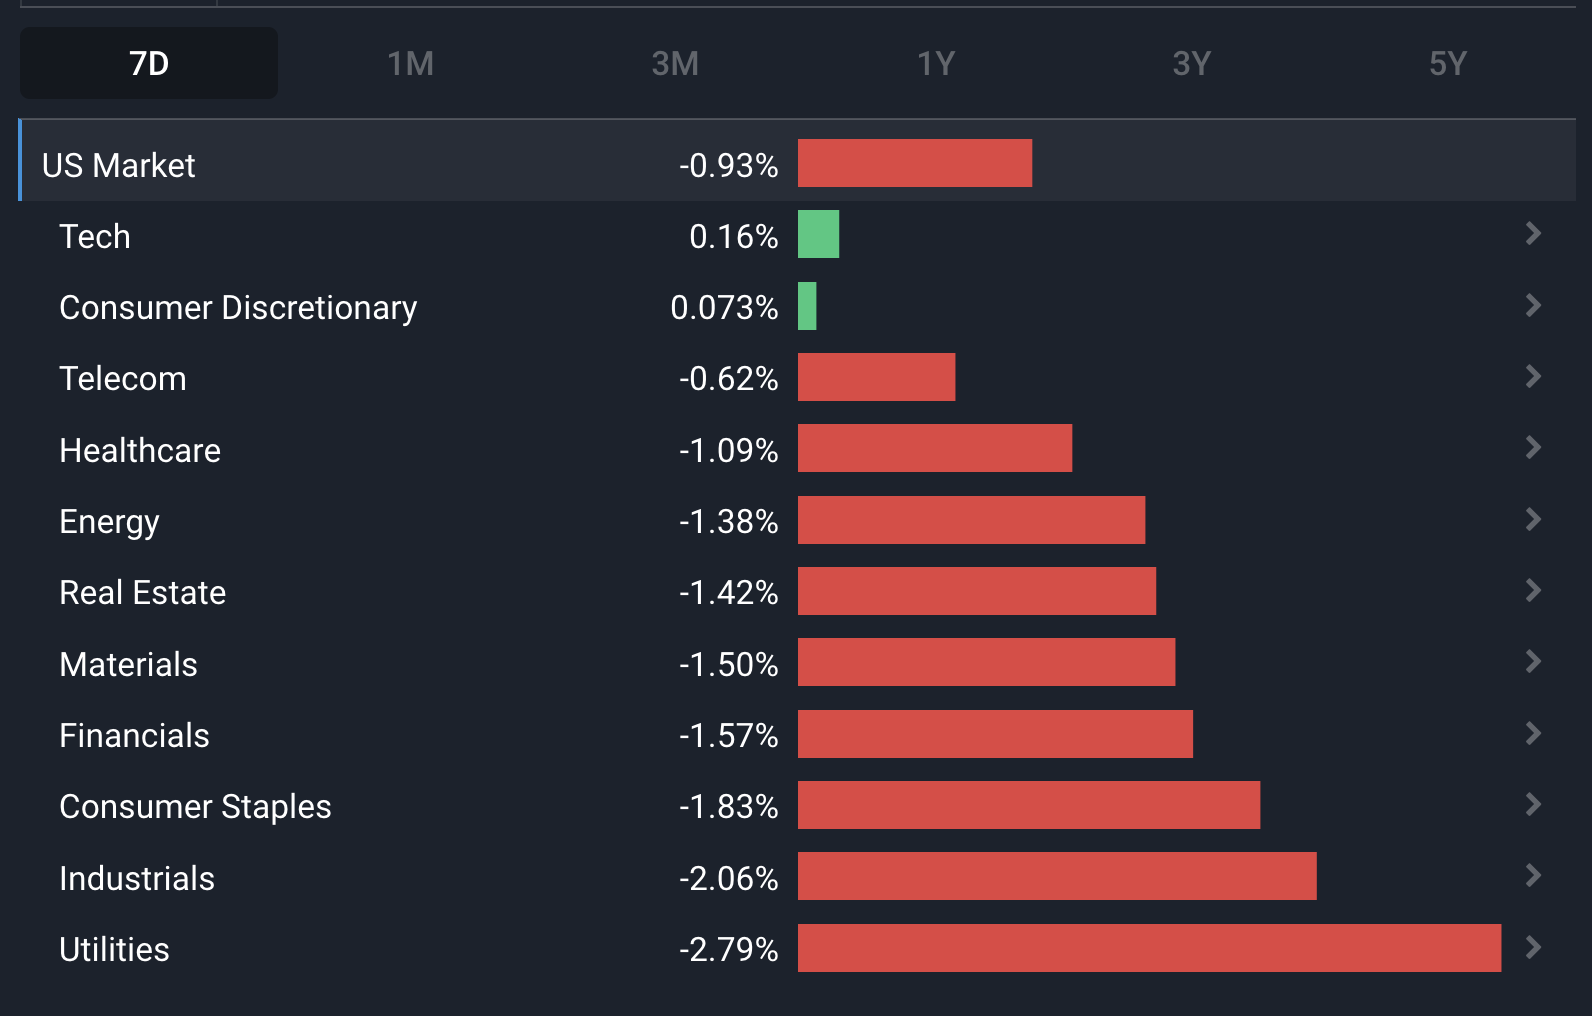
Equity markets pulled back after their strong run up the previous week. It was a very mixed bag in terms of US sector performance. Those smaller growth stocks that had a strong run since late December were amongst the hardest hit, but so were the defensive US Consumer Staples and US Utilities sectors. While all sectors traded lower, the US Consumer Discretionary , US Tech and US Telecom sectors held up best. The market seems to be hoping that analysts overdid it with their downward EPS revisions for these sectors.
Some of the developments we have been watching over the last week include:
- Some emerging markets may provide growth appeal that developed markets may lack in 2023 onwards.
- US 2-year yields have fallen the most since the cycle began, which suggests rates may be close to peaking.
- US government borrowing has reached the $31.4 trillion debt ceiling - meaning it will need to be raised to prevent a government shutdown.
Will Emerging Markets Shine in 2023?
Market strategists have mixed views on the outlook for emerging markets this year. In 2022 emerging markets had a rough year with the MSCI Emerging Markets index down 42% at one stage. Emerging market indexes have actually disappointed investors since 2007, though there have been some pockets of strength.
Looking forward, a slowdown in global growth and high interest rates are likely to weigh on corporate earnings everywhere for at least the first half of 2023. But there are a few factors that could boost emerging market assets at some point down the line.
Emerging market valuations
Emerging market equities are generally cheaper than those in developed markets. The table below shows the relative valuation of selected developed and emerging markets, along with average P/E ratios and EPS growth forecasts. The red bars reflect the P/E ratio divided by the growth forecast (ie. the PEG ratio) which normalizes the valuation for a given level of growth. It’s normal for EM equities to trade at a discount, but that discount can vary substantially as the available alternatives vary.
.png)
from Simply Wall St Markets Page
Impacts of Slowing inflation, rate hikes and the USD on emerging markets
When interest rates are rising or the USD is strengthening, emerging markets carry significant risk. Rising rates put EM finances at risk, and a strong dollar means EM assets carry additional currency risk. EMs are typically home to heavily indebted countries that have their debts denominated in USD. In cases like this, a rising USD will mean that a greater amount of the home currency is required to service the same debt. Conversely, countries that rely on exports should benefit from increased trade with the US as the cost of importing goods into the States falls as the USD rises.
When the market begins to believe inflation and rates are peaking, the perceived risk declines. The same is true for the USD, and if the greenback weakens, EM assets become more valuable.
Other potential catalysts for emerging markets
Bond yields have risen around the world, and EM bonds now offer very attractive yields. Those yields become even more attractive when rates are perceived to be peaking. Capital flows into equities tend to follow flows into bonds as they lead to currency stability.
China is still a bit of a wildcard, but there is at least some hope of an economic recovery which would result in rising demand for natural resources. Commodity exports are an important driver of economic growth in emerging markets.
Morgan Stanley also pointed out that shifting trade relationships could create opportunities as companies diversify exposure away from China. Apple for example is moving iPhone production to India ( as much as 50% by 2027 according to recent reports ).
💡 The insight: Tech dominance has suppressed growth in Emerging markets
Emerging market equities have underperformed for a while now, but that hasn’t always been the case. Prior to 2010, emerging markets offered investors some of the best growth opportunities. This chart shows the price performance of the MSCI Emerging Markets index (red) and the S&P 500 index (blue) from 2004 to 2022.
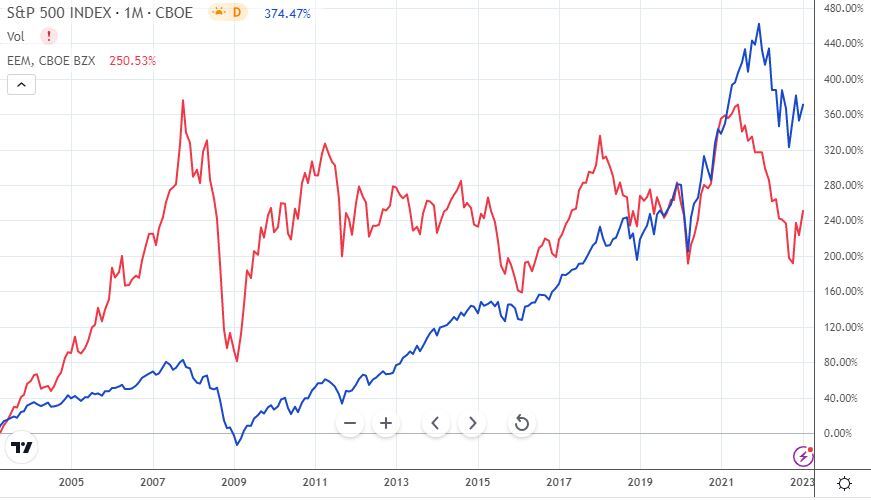
Emerging market countries have developing economies and growing populations, which means economic growth rates are typically higher than they are in developed economies. Prior to 2010 investors in the US and Europe had limited options if they wanted to invest in riskier companies with higher growth potential.
That changed with quantitative easing and the tech innovations of the last decade, and the Nasdaq became an attractive option for investors looking for growth. At the same time, China’s economic growth decelerated and commodity prices began to fall, resulting in lower earnings growth in emerging markets.
Could that reverse now? Last week we covered Howard Marks’ essay in which he considered the implications of rates staying higher for longer. If that is the case, EPS growth for developed market equities could be lower than it has been over the last decade. This might force growth investors to look elsewhere, as they did between 2000 and 2007.
What this means for investors
It’s probably premature to pile into emerging market equities right now. But it's something to start thinking about if you believe the environment for US, European, Canadian, and Australian companies will be more challenging going forward.
For a few ideas, have a look at our collections of companies based in Latin America and Africa , and keep an eye out for our upcoming Asia collection! Increasing numbers of companies based in emerging markets have dual listings on US and European exchanges too, so you don’t necessarily need to invest directly in those markets.
The other group of stocks to consider is the companies that rely on emerging market countries for growth - Apple (Nasdaq:AAPL) , McDonald’s (NYSE:MCD), Netflix (Nasdaq:NFLX) and Nike (NYSE: NKE) are some examples.
Bond Yields have fallen the most since the start of the hiking cycle
Last week yields on 2 year US treasury bonds fell to 4.1%, their lowest level since October after US CPI fell by the biggest margin since 2020. Does this mean rates have peaked? Not really, but the 2-year yield does give us an idea of where investors think the short term rates are headed.
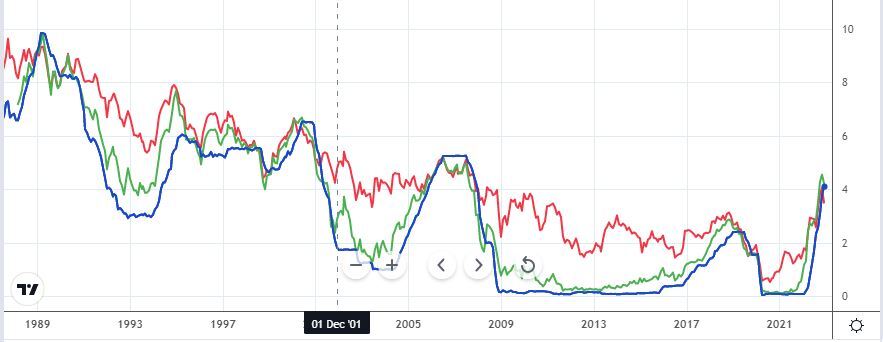
This chart shows the Fed Funds rate (in blue), and the yields on 2-year (green) and 10-year (red) US treasuries from 1988 to the present. 2-year yields usually lead the Fed rate when rates are rising, but track it closely when rates are falling. So when rates are rising, 2-year yields give us a pretty good indication of where short term rates may end up (more on this below.)
The yield curve inversion
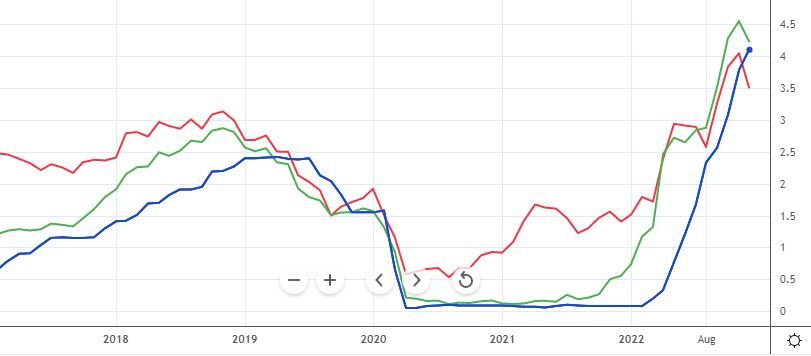
Yields on longer dated bonds are usually higher than shorter dated bonds because investors want a higher return to compensate them for taking on risk for longer. The chart above, and the six year chart below, show that the 10 year yield is usually quite a bit higher than the 2-year yield.
The 2-year yield rose above the 10-year yield in the middle of last year ie. the yield curve inverted. This implies that investors see more risk in the short term, and it almost always precedes a recession.
💡 The Insight: Until inflation lowers significantly, don’t expect rate cuts
The Fed Funds rate is an overnight rate, so in theory 2-year yields should reflect the average expected Fed rate over the next two years, though in reality it's a moving target. The fact that 2-year yields have fallen implies the market expects the average fed rate to be around the current level - but could still rise a little in the interim .
A lot of investors are expecting the Fed to pivot and start cutting rates, as we mentioned previously , and this may have contributed to the market strength over the last few weeks. It is likely that rate hikes will slow and be less severe, but if inflation doesn’t come back to within the 2% target, the Fed might keep rates at an elevated level for a while.
What this means for investors
A lot of growth stocks have been rallying as though lower rates are just around the corner. We would be a little cautious about chasing stocks that rely on lower rates to justify their valuations. If you want a margin of safety, build a slightly higher interest rate into your valuation and see if it still makes sense.
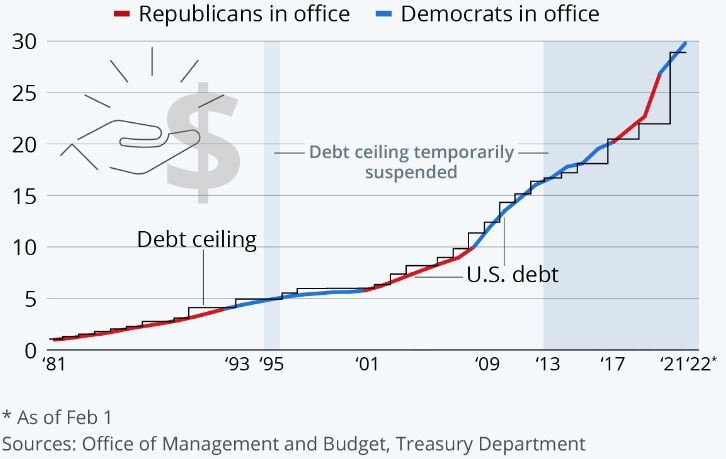
US Government Borrowing Reaches Debt Ceiling
US government debt has reached the $31.4 trillion limit which was raised from $29 trillion a year ago . Hitting the debt ceiling doesn’t mean the government immediately runs out of cash. The US Treasury has a few tools it can use to raise enough cash to last another few weeks. That cash is needed to pay bond holders and for government spending.
To borrow more, Congress needs to raise the cap. This gives the GOP, who control the House of Representatives, a bargaining chip to demand spending cuts. This has happened several times before, and resulted in partial government shutdowns.
The debt ceiling has always been raised in the past, sometimes as a matter of routine, and sometimes after a lot of debate and negotiation. The chart below reflects the number of times it happened between 1981 and early 2022.
The Insight: The debt ceiling will probably rise, but not without a fight… and long-term consequences
US government debt is now approaching 140% of GDP. The argument against raising the ceiling is that if this level isn’t already unsustainable it soon will be. In reality it’ll probably keep rising as long as investors are prepared to buy US bonds - at which point there will be reckoning.
The argument in favor of raising the limit is that not doing so will result in the US defaulting on debt (which would also damage its credit rating) and not being able to pay government employees.
What this means for investors
In all likelihood the debt ceiling will be raised - but a protracted standoff between the GOP and Democrats could lead to another round of market volatility. This could amplify any volatility caused by corporate earnings, or economic and inflation data.
Key Events During the Next Week
There isn’t much economic data this week - but some of it is noteworthy.
On Wednesday Australia’s inflation rate will be released.
On Thursday the US advance GDP growth rate and durable good orders will point to the strength of the economy.
And on Friday, US personal income and spending data will indicate the strength of consumer balance sheets.
Earnings season gathers steam with some big names reporting (the other big tech companies report next week):
- Microsoft (Nasdaq:MSFT)
- Johnson and Johnson NYSE:JNJ)
- Lockheed Martin (NYSE:LMT)
- AT&T (NYSE:T)
- Freeport-McMoran (NYSE:FCX)
- IBM (NYSE:IBM ) Tesla (Nasdaq:TSLA)
- Mastercard (NYSE:MA)
- Visa (NYSE:V)
- Intel (Nasdaq:INTC)
- Texas Instruments (Nasdaq:TXN)
- Boeing (NYSE:BA)
Have feedback on this article? Concerned about the content? Get in touch with us directly. Alternatively, email editorial-team@simplywallst.com
Simply Wall St analyst Richard Bowman and Simply Wall St have no position in any of the companies mentioned. This article is general in nature. We provide commentary based on historical data and analyst forecasts only using an unbiased methodology and our articles are not intended to be financial advice. It does not constitute a recommendation to buy or sell any stock and does not take account of your objectives, or your financial situation. We aim to bring you long-term focused analysis driven by fundamental data. Note that our analysis may not factor in the latest price-sensitive company announcements or qualitative material.
Richard Bowman
Richard is an analyst, writer and investor based in Cape Town, South Africa. He has written for several online investment publications and continues to do so. Richard is fascinated by economics, financial markets and behavioral finance. He is also passionate about tools and content that make investing accessible to everyone.