
“As in most subjects relating to money management, there's a wide diversity of opinion on portfolio concentration versus diversification.” - Whitney Tilson
When creating a successful portfolio, often the first thing that comes to mind is diversification. The 60/40 portfolio is highly debated, and despite experiencing similar volatility to its benchmark, seems to have underperformed over the past 10 years.
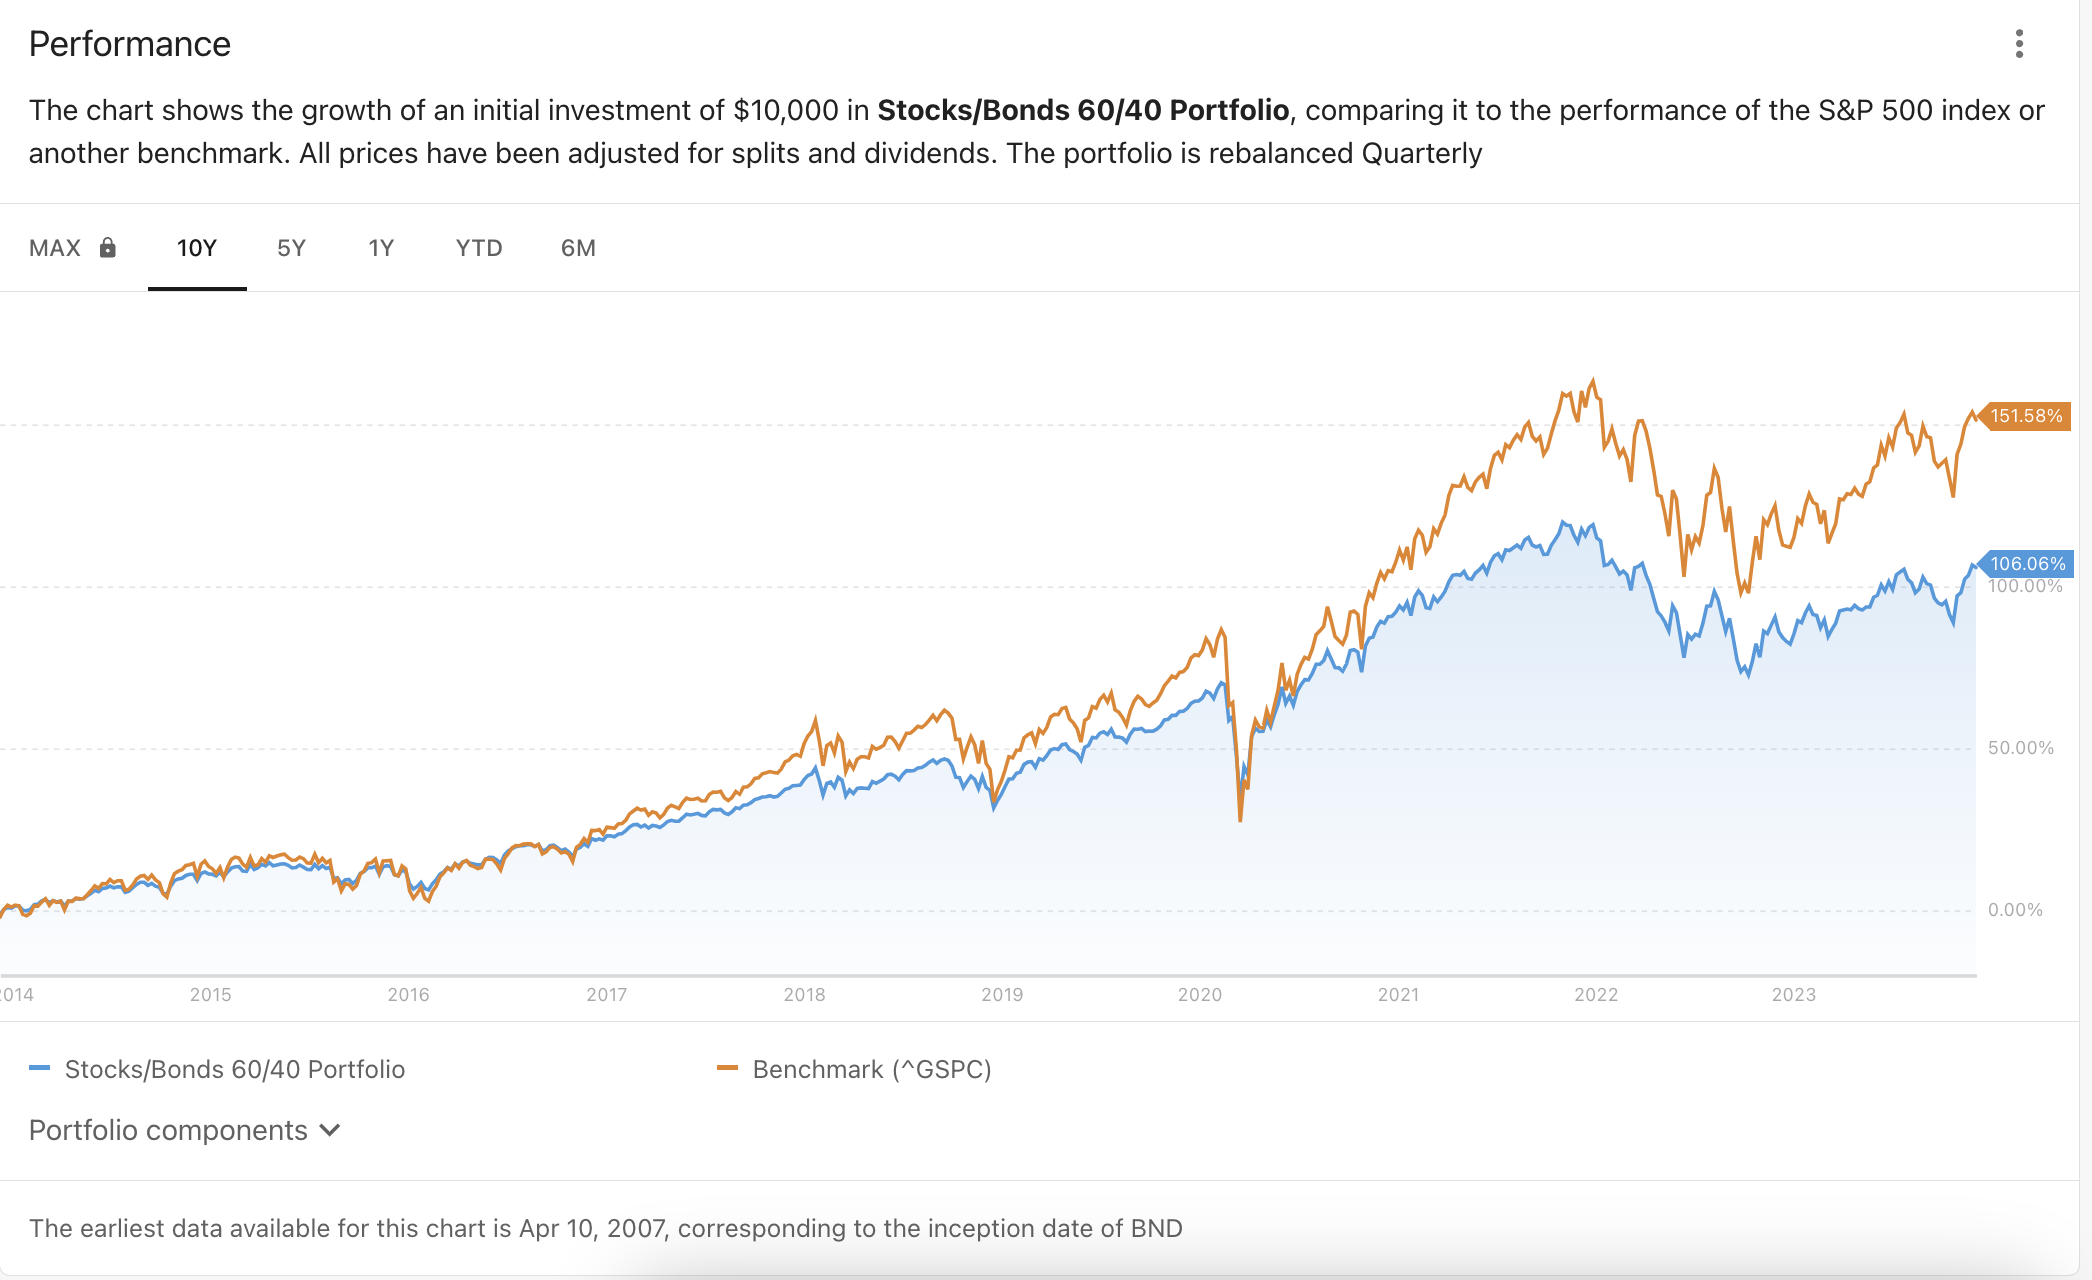
It makes sense to reduce volatility by broadening your exposure to different industries, markets and assets, but does this come at the impact of portfolio returns? Let's find out!
This week we are having a look at the pros, cons, and risks of diversification in a stock portfolio. But before that, with all the talk about bond prices recently, we’ll dive into what the ‘normal’ relationship between stock and bond prices looks like - if there is such a thing.
🎧 Would you prefer to listen to these insights? You can find the audio version on our Spotify or Apple podcasts !
The Relationship Between Stock and Bond Prices
Over the last two years, we have mentioned the relationship between interest rates and equity valuations several times. The three key aspects of this relationship are as follows:
- 📉 Higher rates mean valuations fall as future cash flows need to be discounted at a higher rate.
- 🤔 Higher bond yields give investors an alternative with a meaningful yield.
- 🏦 Higher rates also put pressure on borrowing costs for companies and their customers, which affects sales, expenses and profits.
This was the reason stock and bond prices became highly correlated in 2022. Reminder: Bond prices are inversely related to bond yields. If you missed it, we explained the relationship between bond prices and yields in October .
Now that the largest rate increases are behind us (hopefully! 🤞), we thought it would be worth looking at the relationship between bond and stock prices over longer periods of time.
The chart below, from Shroeders, shows the correlation between bond and stock returns from 1931 to 2021. When the line is above zero, stocks and bond prices move together, so:
- Higher yields = lower bond prices = lower stock prices , and vice versa.
When the line is below zero, they are negatively correlated, so:
- higher yields = lower bond prices = higher equity prices.
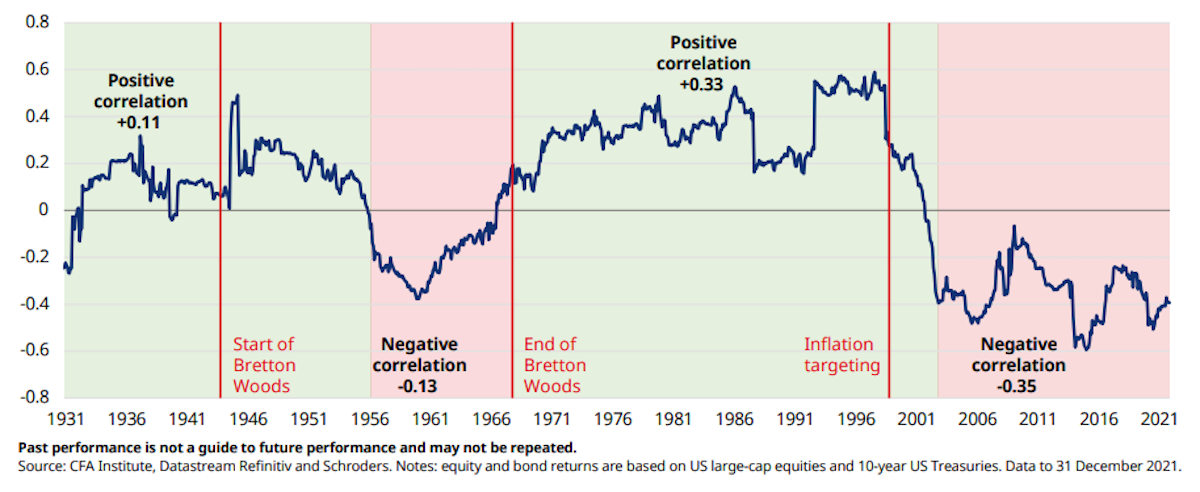
The chart shows that there have been very distinct periods of both positive and negative correlation, but most of the time the correlation is quite low.
So what conclusion can we draw from this?
In general, rising and high inflation and interest rates results in a positive correlation. When inflation is low and stable, the correlation is more likely to be negative.
In the past, changes in bond prices aren’t nearly as significant as they’ve been in the last two years, so other factors came into play. As an example, from 2002 to 2021 bonds were viewed as a safe haven, so money moved back and forth between the two markets as risk appetite increased and decreased.
The reason we point this out is that the relationship can change over time. The correlation was positive for most of 2022, and it's been positive again since July. This can create the impression that bond yields will keep dictating what happens with stocks - which may not be the case.
💡 The Insight: Keep An Eye On Corporate Bonds When Looking At Individual Stocks
We’ve covered government bonds in the past, but let’s focus in on corporate bonds and what the average investor should think about when investing in high interest rate environments.
Regardless of what happens at the macro level, some companies do have significant exposure to higher interest rates. While some companies managed to borrow at very low rates in 2020/21 with long maturities, others may have taken the risk and opted for short-term borrowings with maturities of 3-years. These are the companies that will soon need to refinance in much less favourable conditions.
The ones most at risk are the corporates that issue high yield (or junk) bonds , but irrespective of bond yields, there are a lot of companies with significant amounts of debt coming due in the next two years.
The problem for these companies is simple: There is greater risk of default now, and so investors will demand greater yields on that company’s bonds to justify the risk . Effectively, it will cost companies more to refinance.
Think of it like remortgaging your house in the current interest rate environment after having previously paid a much lower interest rate.
The longer rates stay elevated, the more these problems compound and more companies will struggle to refinance.
To find out how much a company will need to refinance, we first need to find out how much debt they have and then review the maturity profile of that debt.
On the Simply Wall St company reports, you can get an overview of each company’s assets and liabilities by looking at section 4: Balance Sheet Health. The chart below shows Boeing’s financial position, which includes a lot of debt.
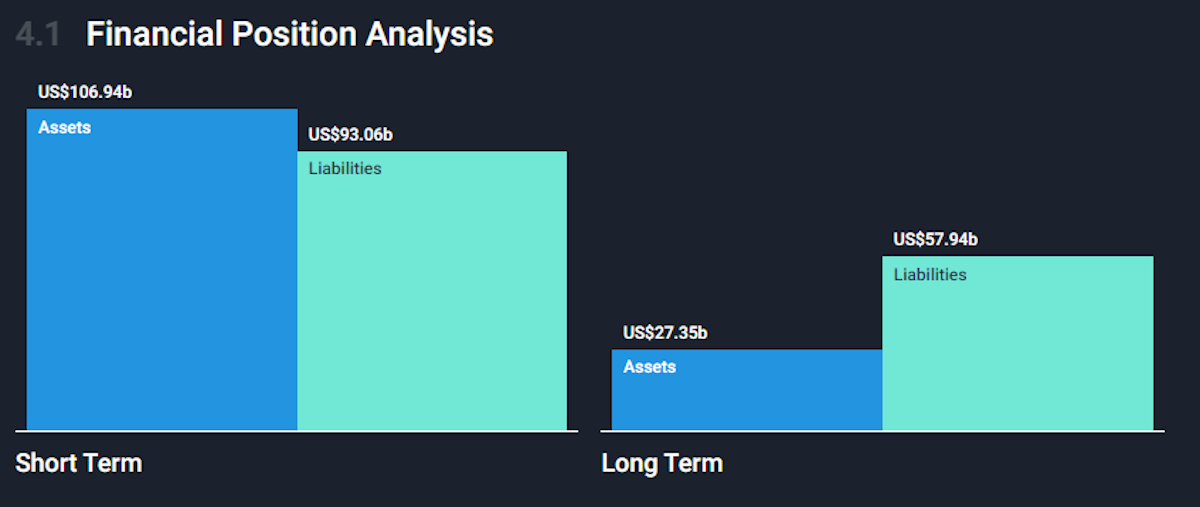
Boeing Financial Position - Image Credit: Simply Wall St
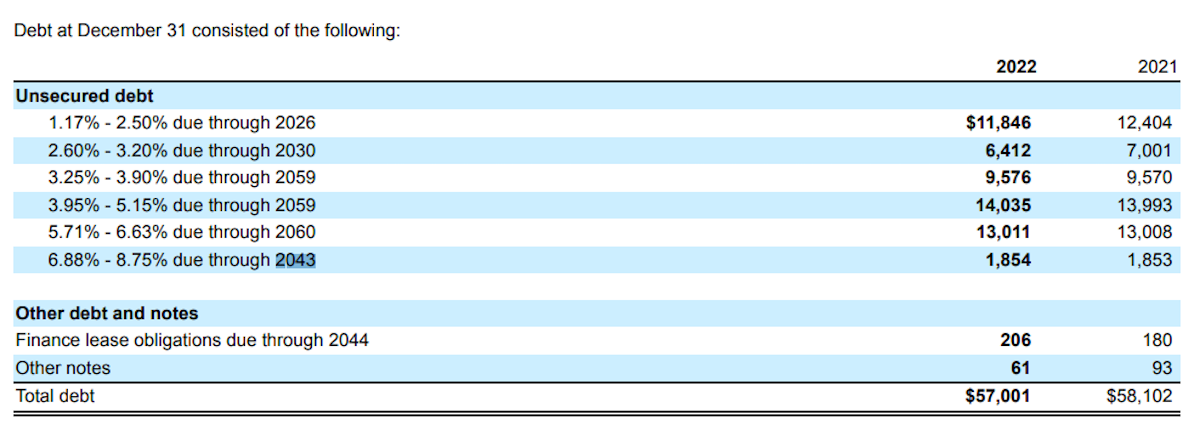
Then, to find out how that debt is structured, you can have a look at the company’s own financial statements, which you can find on the company website. Usually, the annual report will have a more comprehensive breakdown than quarterly reports.
This is from Boeing’s annual report (10-K). We can see that of the $57 billion in long term debt, $11.8 billion is due before the end of 2026. This debt has a low interest rate, so Boeing’s interest costs are likely to rise unless interest rates fall significantly.
The Pros and Cons of Diversification
We were reminded recently of Charlie Munger’s criticism of diversification - or as he called it, “ diworsification” . Munger correctly pointed out that it’s easier to find 5 great stocks than 100. Warren Buffett also pointed out that with fewer holdings, you’ll think more intensely about each business.
But there are some situations where thoughtful diversification does make sense. In particular, you need to think about the types of stocks you own and the amount of volatility you can tolerate.
Berkshire Hathaway holds relatively stable companies that typically trade on valuation multiples, but even these stocks have still experienced some large draw-downs. If you own growth stocks trading on higher valuations, you can expect even more volatility. And, if portfolio volatility is likely to cause you to panic or make emotional decisions, that’s another reason to diversify your investments, and you may want to consider the “Sleep Easy” portfolios.
With this in mind, here are a few thoughts on diversification…
Types Of Diversification
You can diversify your investments across asset classes, and within the stock market. Most stocks are correlated to some extent, and the correlation between stocks increases during bear markets.
So to be truly diversified you need to consider other asset classes like gold, bonds and cash. There is a trade-off here though, as equities outperform these asset classes over the long run - so this diversification is likely to act as a drag on returns.
Within the stock market, there are lots of ways to diversify, including:
- 🏗️ Sectors and industries
- 📈 Investing Style : value, growth, cyclical, and dividend stocks
- 📏 Size : Large caps vs small caps
- 🌏 Regional exposure
- 💱 Currency and interest rate exposure
How Many Stocks Is Enough?
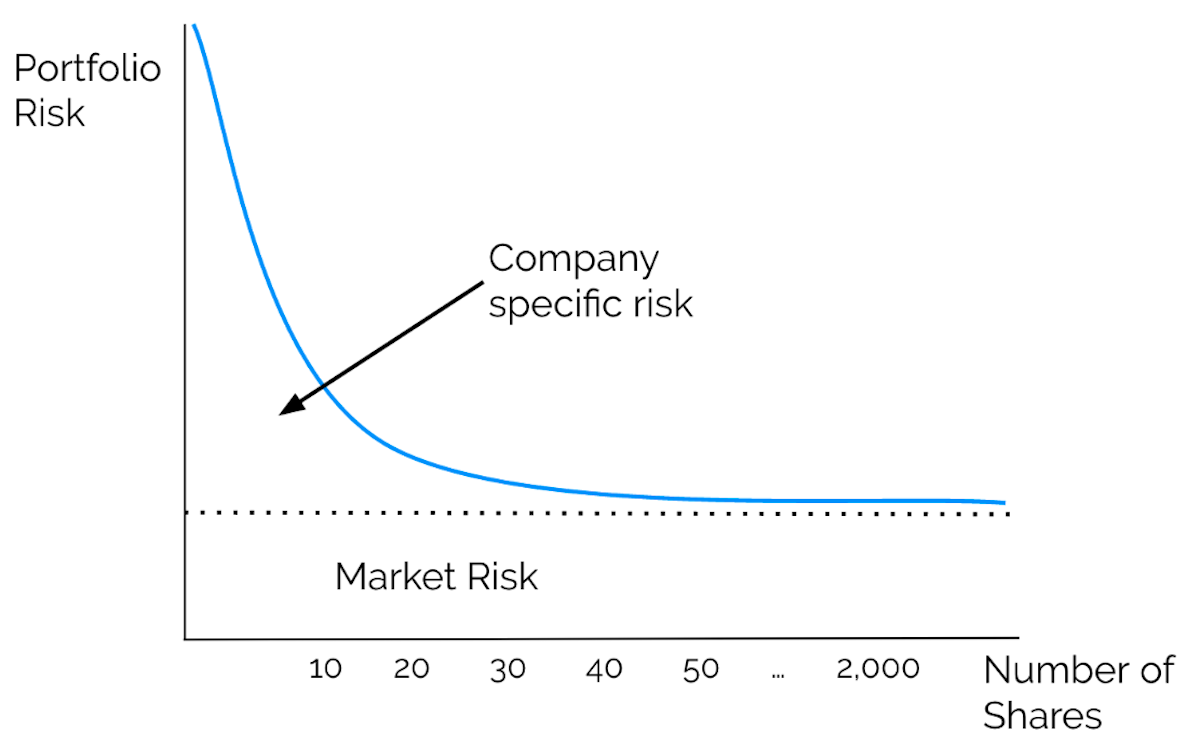
Assuming a portfolio holds stocks across several sectors, the company and sector specific risk can only be diversified to a certain point. Beyond that, the portfolio will still be exposed to market risk regardless of the number of stocks.
Research suggests that the benefits of diversification diminish quickly when a portfolio has more than 20 to 25 stocks.
Does this mean you should target a portfolio of 20 to 25 stocks? Not necessarily, and let’s have a look at why.
The Common Diversification Mistakes to Avoid
If you decide to ‘spread your risk’ across a large number of stocks, there’s a risk that you won’t do the required research before buying each of those stocks.
If you’re only investing 2% or so in each company, a bad decision won’t have a big impact on the portfolio. The problem is that you could end up with a lot of those mistakes, due to poor research, which could result in big losses.
Another mistake is diversifying across a group of companies that come with similar risks. At the end of 2021 a lot of investors held portfolios full of rapidly growing software stocks. While the risk was spread across several stocks, they were all exposed to the same valuation risks.
💡 The Insight: ETFs Are An Easy Way To Diversify
Exchange traded funds that track market indexes like the S&P 500 and the FTSE 100 are already diversified. In fact, they are very diversified. However, you can’t earn market beating returns by tracking the market. A lot of investors choose to own one or two ETFs and a handful of stocks, which gives you a bit of both.
ETFs can also be a great way to get some regional exposure to markets your broker may not have access to. You can often find foreign market i ndices that trade on your local exchange. No more having to wait until markets on the other side of the world open just to get some exposure in your portfolio!
ETFs are also useful if you are building up a portfolio. When you start out you can invest a chunk of your account, say 50% to 75%, in an ETF, and then gradually switch this allocation into individual stocks. By doing this, you’ll be invested in the market, but you can also be patient and wait for great opportunities that meet your criteria for investing.
📣 Feature Spotlight: Monitoring Diversification In Your Portfolio
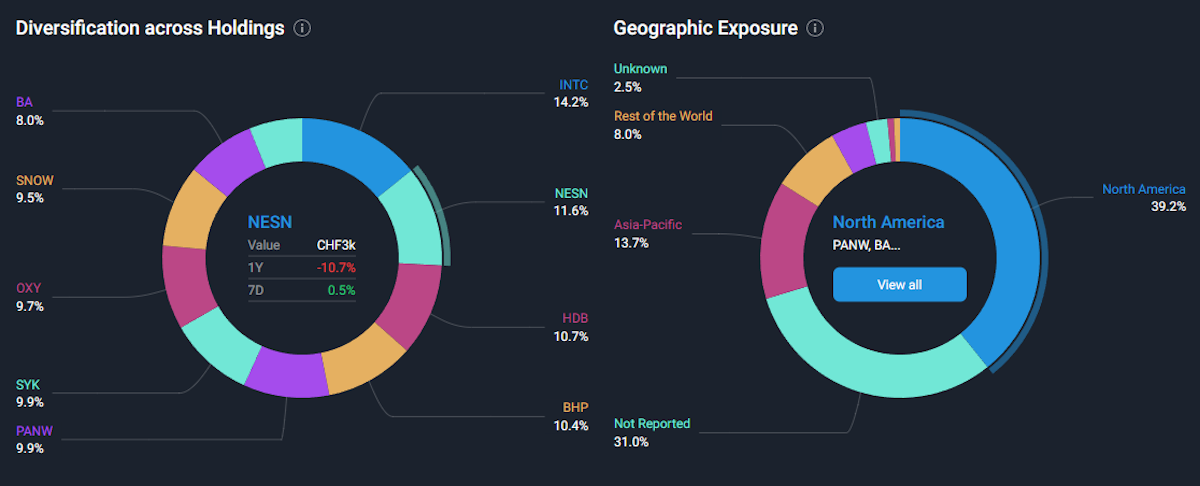
Simply Wall St portfolio reports now include a geographic diversification chart . Click on the ‘Analysis’ tab at the top of the report, and you’ll be able to see how your portfolio is diversified across companies, industries, and geographic regions.
What Else Is Happening?
First a recap of the key data releases we mentioned last week…
- 🇦🇺 Australia’s central bank held interest rates at 4.5% as expected .
- The bank still believes further tightening might be needed - but the economy will get a break until the next meeting in February.
- 🇦🇺 Australia’s GDP growth rate fell to 0.2% in the third quarter . Economists expected 0.4%, so this was disappointing - but could be good news for interest rates in February.
- The sluggish growth rate resulted from lower commodity export prices.
- 🇺🇲 The US JOLTs Job Openings report showed job openings falling to 8.7 million , their lowest level since March 2021.
- This was quite a bit lower than expected and shows the labor market continues to cool.
- The ADP employment report also suggested the labor market is slowing , with payrolls increasing by 103,000 compared to the consensus estimate of 128,000.
And then, a few news items that we thought were worth noting…
- 🇨🇳 Moody’s changed its outlook for China’s credit rating to negative . China has increased its borrowing to fund stimulus programs, and to assist local government and state-owned enterprises.
- China's official debt-to-GDP ratio is quite low, but local governments have accumulated massive ‘hidden’ debts that could be as high as $11 trillion . The central government is trying to convert some of that into government debt, which will become more difficult and expensive if the credit rating is actually downgraded.
- 🍎 Apple and Goldman Sachs are ending the credit card partnership. The Apple Card was launched in 2019 with Goldman Sachs acting as the issuing bank.
- From Apple’s point of view, the card has been a success. For Goldman Sachs, it's been a costly exercise. The unique feature that Apple wanted to offer its customers turned out to be an administrative nightmare for the bank.
- Apple will need to find a new banking partner, which could be a challenge after Goldman’s experience.
Key Events During The Next Week
This is the last big week of economic data releases for 2023, with three interest rate decisions being announced.
The US Fed Funds rate will be set on Wednesday. The target range is expected to remain at 5.25 to 5.5%.
On Thursday, both the Bank of England and the RCB will also announce interest rate decisions, with both expected to keep rates steady.
US Inflation data is also due, with consumer inflation (CPI) out on Tuesday and producer inflation (PPI) due on Wednesday. US retail sales are also due on Thursday.
In the UK, the unemployment rate will be published on Tuesday and GDP and manufacturing data is due on Wednesday.
The last of the S&P 500 companies will be reporting quarterly results, along with lots of small companies. The big names include:
Have feedback on this article? Concerned about the content? Get in touch with us directly. Alternatively, email editorial-team@simplywallst.com
Simply Wall St analyst Richard Bowman and Simply Wall St have no position in any of the companies mentioned. This article is general in nature. We provide commentary based on historical data and analyst forecasts only using an unbiased methodology and our articles are not intended to be financial advice. It does not constitute a recommendation to buy or sell any stock and does not take account of your objectives, or your financial situation. We aim to bring you long-term focused analysis driven by fundamental data. Note that our analysis may not factor in the latest price-sensitive company announcements or qualitative material.

Richard Bowman
Richard is an analyst, writer and investor based in Cape Town, South Africa. He has written for several online investment publications and continues to do so. Richard is fascinated by economics, financial markets and behavioral finance. He is also passionate about tools and content that make investing accessible to everyone.


