
“The exchangeable value of all commodities rises as the difficulties of their production increase.” - David Ricardo
Those looking for potential bargains may have stumbled on some stocks in the Fintech and Commodity sectors…
While some names seem quite enticing from traditional valuation metrics, there is more to it than simply finding stocks with low multiples. So this week we wanted to do a quick review on both sectors, give you some tips to identify when a stock may be a bargain or a value trap , and an update on that elusive commodity "Supercycle" analysts have been talking about for a while.
🎧 Would you prefer to listen to these insights? You can find the audio version on our Spotify or Apple podcasts !
Let’s start with the Fintech space!
Fintech Stocks: Bargains, Or Value Traps?
In June, we published an overview of fintech stocks , which at the time was one of the most beaten-up industries in the market. Since then most of the industry is still struggling, with a few exceptions.
Most of the fintech stocks that had breathtaking rallies in 2020 and 2021 are still 60% to 90% below their peak prices. And while many other technology stocks have recovered some ground in the last year, these smaller fintech stocks haven’t.
While this list includes very speculative stocks like Upstart and Affirm , it also includes two of the leaders in the group: PayPal and Block (aka Square).
So, are these stocks potential bargains, or are they value traps? To answer this, let’s first look at why these stock prices collapsed, and then have a look at why they haven't recovered.
A Look Back To The Past For Fintech
In 2020/21 fintech stocks were part of the rally in fast-growing tech stocks. In addition, there was some overlap (eg. Coinbase , Robinhood ) with the crypto bubble taking place at the same time. This was probably the reason that quite a few fintech stocks IPO’d at that time.
This rally also occurred during the tail end of ZIRP (zero interest rate policy) when all that mattered was growth. They could deliver that growth because they had plenty of freshly raised cheap capital to spend, and consumers were spending, trading and borrowing money online.
All of this made for a massive bubble that quickly deflated when interest rates rose and valuations became unreasonable when growth proved unsustainable.
The Current Situation For Fintech Stocks
When technology stocks collapsed last year, investors turned their attention from growth to profitability, and companies had to do the same - hence the sector-wide layoffs at the end of 2022.
Since then, many of the non-finance technology growth companies have managed to improve their margins despite slower revenue growth.
Most of the smaller fintech companies (and some larger ones) have struggled to do this. They have either experienced a massive drop in revenue without a recovery, or, they haven't managed to improve margins despite rising revenue.
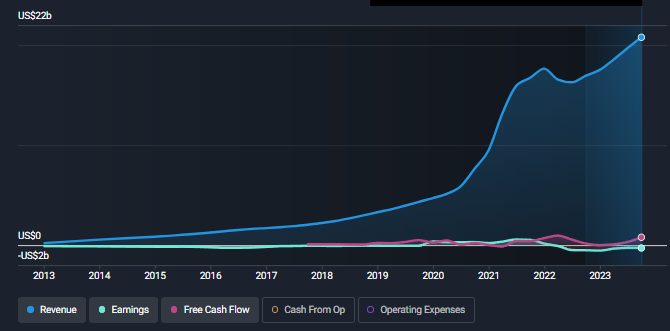
The chart above from Block’s company report illustrates how little earnings have improved despite higher revenue. Typically we like to see earnings growing faster than revenue as a company achieve ’s scale. In Block’s case, we see the opposite.
The graphic below illustrates one of the reasons margins are under pressure:
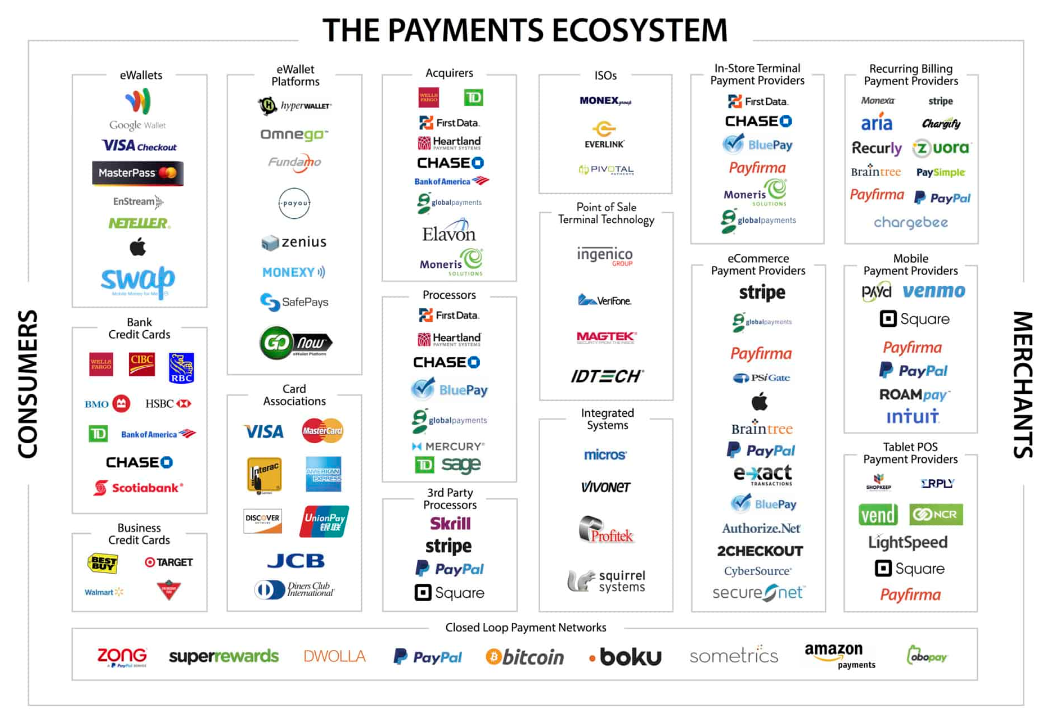
This image only includes companies in the payments ecosystem, leaving out lenders, investment platforms and others.
Clearly, the payments ecosystem is a very crowded market, which keeps downward pressure on fees. This might not change until the industry consolidates and there are fewer competitors.
💡 The Insight: Avoiding The Fintech Value Traps
A “value trap” is a stock that looks ‘cheap’, but in time turns out to be expensive. This happens when prior earnings turn out to be unsustainable, or when expectations for the future turn out to be too high.
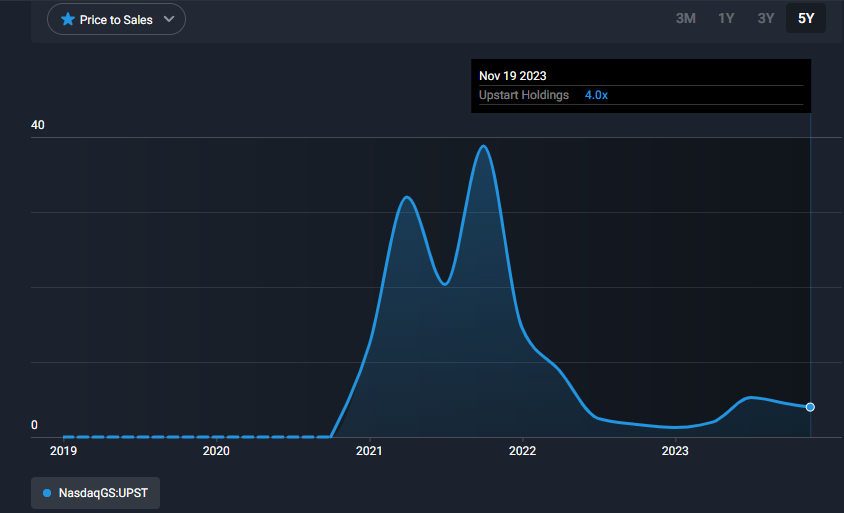
Upstart’s price-to-sales ratio has fallen from 40x in 2021 to 4x now. It may appear to be a bargain, but that depends on how things turn out in the future.
In time, some of these beaten-down companies may turn out to be value traps, while others could turn out to be bargains.
In general, some of the things you can consider to reduce the risk of owning a lemon include:
- 🔍 Investigate earnings quality (which we covered in detail recently ), particularly non-recurring revenue.
- 💪 Make sure the company has a genuine competitive advantage , including unique and proprietary technology, network effects, partnerships, and economies of scale.
- ⚖️ Look at margins and unit economics to see if the company really can make a profit as it scales.
- 🤔 Consider the competitive landscape and the size of the addressable market . Is this a race to the bottom, or a winner-take-all situation?
The last point is of particular importance to the fintech industry. Some companies are competing to become a critical cog in the financial system, as Visa and Mastercard have already become.
If they achieve that, they’ll have pricing power, and margins will then improve . In that case, the current financials might not matter - but, the question then is whether they have what it takes to get there.
If you look at the company reports for Visa and PayPal , you’ll see competing narratives with very different fair value estimates for these companies. These narratives include the types of catalysts that could determine just how sustainable their margins may be.
Huge Divergence in Commodities Performances
Just over a year ago, we looked at the commodity market . At the time, some analysts were calling for a new super cycle in commodities. So what’s happened since then?
It’s been a mixed bag, with most commodity indexes flat to down. The composition of these indexes varies widely, and performance often depends on the weighting given to oil.
Looking ‘under the hood’ we see massive divergence, ranging between +102% (orange juice) to -76% (lithium) and everything in between.
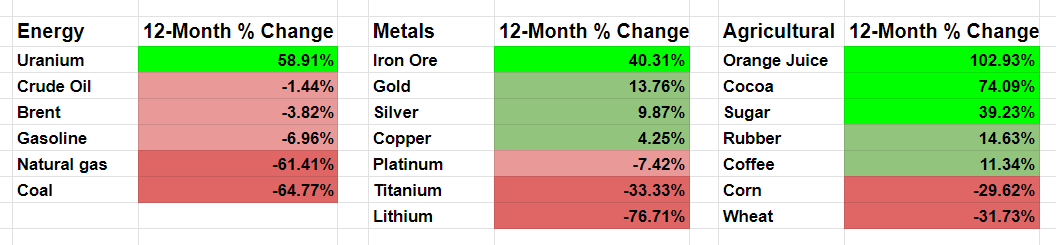
Some of these large price movements have been the result of a normalization in prices:
- ⛽ Natural gas and coal are down relative to the very high prices that resulted from the supply shock after Russia invaded Ukraine.
- 🌽 Corn and wheat are down for the same reasons , and the fact that production increased due to shortages in 2022.
Others are idiosyncratic:
- 🪫 Lithium is lower relative to the record prices set in 2022. Demand from the EV industry has also slowed, while production has increased.
- 🧑🌾 Agricultural products like orange juice and cocoa have been affected by weather systems in Florida and East Africa , which have resulted in very small harvests.
- ☢️ Uranium is higher due to renewed interest in nuclear energy after the energy crisis in Europe.
- 🏗️ Iron ore has been affected by a slight recovery in demand from China , industrial action in Australia and weather-related delays in Brazil.
The overall commodity market has also been affected by the anticipation of a recession and persistent higher interest rates, which was partially offset by OPEC+’s production cuts.
So What’s Happening With The Commodity Supercycle?
When we exclude the unique events affecting certain commodities, the overall market is still subdued. But the market is still tight (supply and demand are closely matched), so that could change if demand increases.
“Supercycles” (which are mostly relevant to oil, coal, iron ore, and copper) occur when demand increases faster than supply can be increased.
Increasing capacity for oil and metal producers takes years, so companies have to continuously invest in multi-year projects for supply to keep up with demand. However, in the last few years, cash flows have often been spent on dividends and buybacks to keep investors happy.
So, if interest rates start falling and global growth normalizes, demand could begin to outstrip supply. But as long as rates stay high, and growth remains uncertain, the supercycle will probably remain on hold.
Assessing Commodity Producers And Their Valuations
Commodity-producing cyclical companies are very different from other companies. Investing successfully in them is often paradoxical when compared to buying high-quality compounders to own over the longer term.
They don’t have recurring, predictable revenues, and margins can fluctuate wildly. Revenues are inextricably linked to both the price and volume of the commodities they deal with.
This means traditional valuation metrics like the P/E ratio can be very misleading for commodity producers. PE ratios can often be at their lowest at the peak of a commodity cycle, and at their highest during the bottom of a commodity cycle.
When you are working out a reasonable price to pay for a commodity-producing stock, you need to decide on the following:
- The average selling price and volumes the company can achieve for its commodities over a reasonable holding period.
- Will the price and volume of the commodity revert to the mean which is higher (or lower) than today’s prices?
- A realistic P/E multiple the market will pay when you exit the position .
- You’ll want to monitor the outlook (where we are in the cycle for that commodity) and what that could mean for the price the market will pay for the business - a similar mean reversion approach to what you’d use with the underlying commodity.
- Often, the best time to invest in commodity stocks (those with a healthy balance sheet) is when everyone else is running for the exits, which should help you find a solid company at a fair price - just in time for the next cycle.
💡 The Insight: Think in Cycles on Cyclicals
A key point on investing in commodity and cyclical stocks raised by Gautam Baid in his fantastic book “ The Joys of Compounding ” is to focus on the capital cycle, and price and mean reversion. Questions like these can help you estimate where we are in the cycle:
- Are these companies starved of capital, or flush with cash?
- They’re typically starved for capital at the bottom and flush with cash at the top (paying big dividends, buybacks, etc)
- Is the PE ratio higher or lower than the historical average?
- If higher, it may indicate it’s near the bottom of the cycle, and if lower, it may indicate we’re near the top of the cycle. Confusing, we know!
- Where is the price of the commodity it produces, relative to its average?
- If higher than average, we may be near the peak of the commodity cycle, and if lower than average, we may be near the bottom of the cycle.
- If it produces multiple different commodities, that’s great because it reduces its reliance on any one commodity cycle.
If you haven't seen it already, Simply Wall Street now includes a note-taking feature. This is included just below the first section of the report, but you can access it in your portfolio and watchlist as well.
You can make multiple notes for each stock, and they’re saved so whenever you need them they’re easily filed right beside that stock.
You can use this notepad to jot down important points during earnings calls, or when reading news releases. You can also make a list of questions for yourself while you scroll through the company report. We’ll use the BHP Group company report as an example:
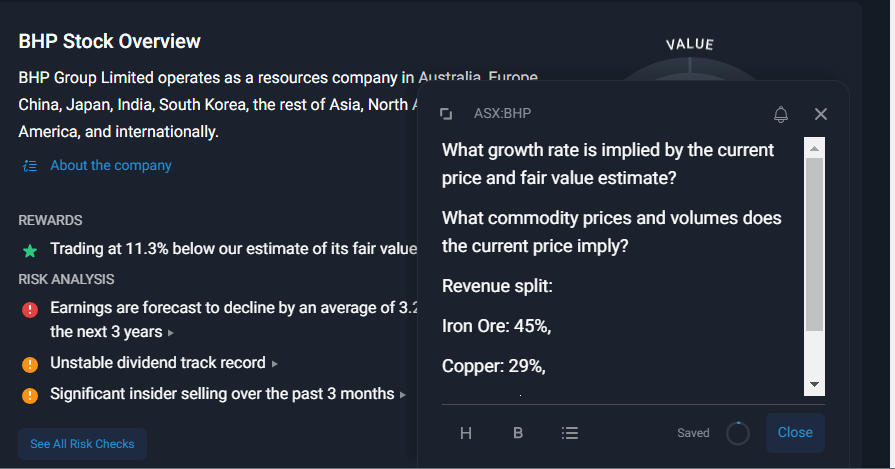
As we scroll through BHP’s company report, we can take notes on how the market is valuing the business relative to its peers and industry (check 1.2 and 1.4), and how much revenue it generates from different commodities (section 3.1).

Now that we’re here, we can see how the market is valuing this commodity producer, and how much revenue it generates from different commodities.
From there, we need to ask ourselves those questions like:
- Is this business starved of capital, or flush with cash?
- Is the PE ratio higher or lower than the historical average?
- Where is the price of the commodity it produces, relative to its average?
- What is the outlook of supply and demand for each commodity it produces?
Once you have answers to all these questions you can start developing a set of catalysts to make up an investment narrative and work out the price you’d need to pay to still earn a return and give yourself a margin of safety in case you’re estimates are slightly off.
What Else Is Happening?
First a recap of the key data releases we mentioned last week…
- 🇺🇸 US: Minutes from the last Fed FOMC meeting revealed no surprises. The minutes stated that the committee remains ready to raise rates further if needed .
- They also see policy remaining restrictive until they are convinced inflation will fall to the 2% target.
- 🇦🇺 Australia : The minutes from the recent central bank policy meeting also reflected a hawkish stance.
- The minutes noted that “ its forecasts for inflation to decline to within its 2-3% target range by the end of 2025 were based on one or possibly two more interest rate increases .”
- 🇬🇧 UK Chancellor of the Exchequer, Jeremy Hunt, announced a range of measures to stimulate the sluggish economy.
- These included tax cuts, raising the minimum wage, and investments in manufacturing and AI.
- Inflation in the UK is still 4.6%, so the Finance Ministry and Central Bank have a tough challenge ahead: reigniting growth while simultaneously taming inflation.
- 🇨🇦 Canada’s inflation rate fell to 3.1% in October, from 3.8% in September.
And then, a few news items that we thought were worth noting…
-
💻 Nvidia’s quarterly results were quite something - I hope you’re sitting down…
- Revenue of $18 billion was up 206% compared to the same quarter last year, and EPS was up 50% since the previous quarter and 1200% year-on-year!
- Not bad for a company that started out making tech for gamers 30 years ago.
- They have set a very high bar to beat going forward, but maybe they can.
- At this point, it seems that keeping up with demand will be the main challenge.
-
🤖 The saga at OpenAI has been covered all over the media, so we won’t rehash it. If you missed it, here's a good summary , and here’s a hilarious video summary .
- Just one observation: At the risk of sounding like Captain Hindsight, the structure of OpenAI was always going to be a problem: A non-profit that owns a for-profit with one very large investor and client ( Microsoft ), along with other investors, and a board with competing agendas.
- Businesses usually work best when incentives are aligned between shareholders, the board, management, and staff. This is something to consider with any investment, and it seems like it was somewhat overlooked at OpenAI.
Key Events During The Next Week
The key economic data releases this week start on Wednesday with US GDP Growth data. On Thursday the US Core PCE Price Index, and personal spending and income data will be published.
On Thursday, Eurozone inflation and employment data is due to be released.
China’s NBS Manufacturing PMI (purchasing manager’s index) is due on Thursday and the Caixin Manufacturing PMI on Friday.
As we enter the tail end of earnings season, there are still a few prominent cloud software companies and retailers due to report:
Have feedback on this article? Concerned about the content? Get in touch with us directly. Alternatively, email editorial-team@simplywallst.com
Simply Wall St analyst Richard Bowman and Simply Wall St have no position in any of the companies mentioned. This article is general in nature. We provide commentary based on historical data and analyst forecasts only using an unbiased methodology and our articles are not intended to be financial advice. It does not constitute a recommendation to buy or sell any stock and does not take account of your objectives, or your financial situation. We aim to bring you long-term focused analysis driven by fundamental data. Note that our analysis may not factor in the latest price-sensitive company announcements or qualitative material.
Richard Bowman
Richard is an analyst, writer and investor based in Cape Town, South Africa. He has written for several online investment publications and continues to do so. Richard is fascinated by economics, financial markets and behavioral finance. He is also passionate about tools and content that make investing accessible to everyone.