China's Evolving Economy, And The Pros And Cons Of Bond ETFs

Reviewed by Michael Paige, Bailey Pemberton
“When growth is slower-than-expected, stocks go down. When inflation is higher-than-expected, bonds go down. When inflation is lower-than-expected, bonds go up.” — Ray Dalio
This week we’re checking in on China’s economy after some better than expected data and another round of stimulus.
We’ll also be taking a look at bonds - more specifically bond ETFs - which have caught the eyes of investors since yields have been on the rise. Soaring yields have now made bonds quite the appealing investment compared to stocks, so let’s take a look at some of the ways you can get exposure to them!
Let’s dive into China’s economy first.
🎧 Would you prefer to listen to these insights? You can find the audio version on our Spotify or Apple podcasts !
🇨🇳 Is China’s Recovery Back On Track?
Maybe. China’s economy is showing some signs of improvement after months of weak data releases, but it’s not out of the woods yet.
Last week The National Bureau of Statistics reported that the country’s economy grew 4.9% year on year in the third quarter, which was higher than the 4.6% expected by economists.
While this was lower than the second quarter reading (6.3%) it came off a higher base, so it’s probably more significant.
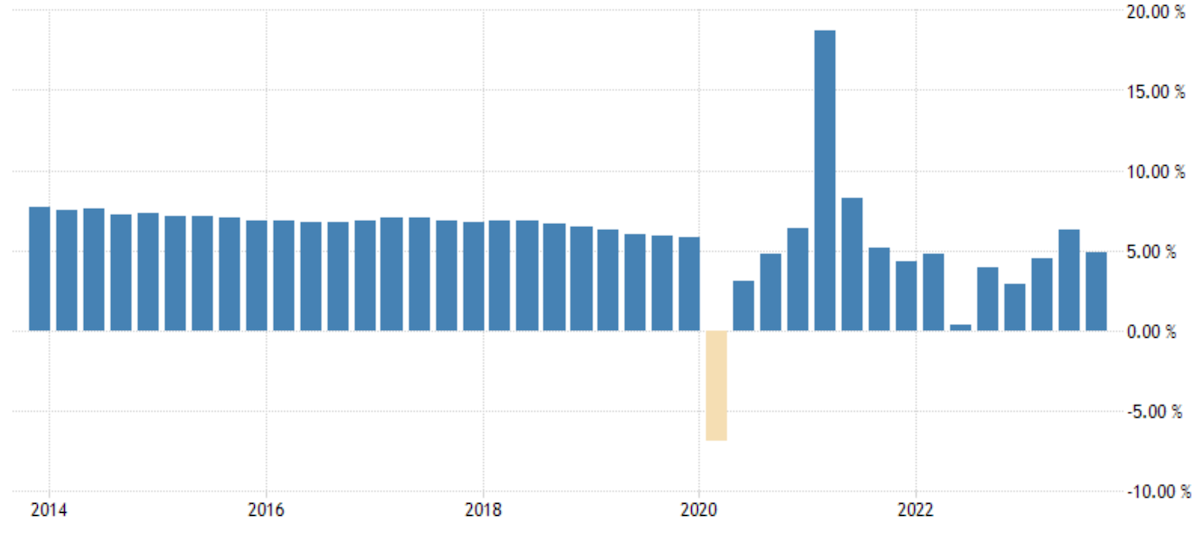
While 4.9% is a long way from the double digit growth China has managed to deliver in the past, it's actually just about where it was prior to the pandemic.
Besides stronger GDP data, recent industrial output 🏭 and retail sales 👕 data has also improved.
However, despite the improved data, China’s economy still faces several major challenges, including:
- A very weak property sector with investment down 9% YTD.
- Rising youth unemployment , which has risen from 14 to 22% in just a few years.
- Exports and imports both remain depressed .
- Business confidence remains low - but improving slowly.
To further stimulate the recovery, China is now increasing its budget deficit and has approved a new bond issue worth 1 trillion yuan ($137 billion USD) to improve infrastructure.
💡The Insight: China’s Economy Is Evolving
Depending on what you look at, China’s economy is sending mixed messages.
Several investment banks have now upgraded the outlook for China’s economy , while other economists paint a far bleaker picture.
But investors don’t need to take a binary view, as the economy is also evolving. There will probably be pockets of opportunity regardless of the headline numbers.
The FT pointed out that China’s per Capita GDP is still ranked 76th in the world , which is 22% of the US’s in 2022, and half that of Poland’s.
But they pointed out it might not have peaked yet, meaning there could still be room for a lot of improvement if it got closer to other Asian countries.
Having a population that grew rapidly was a detriment to any per capita figures, but considering China’s population growth has stagnated and its population has actually declined since 2021, GDP per capita could likely grow over the next few years.
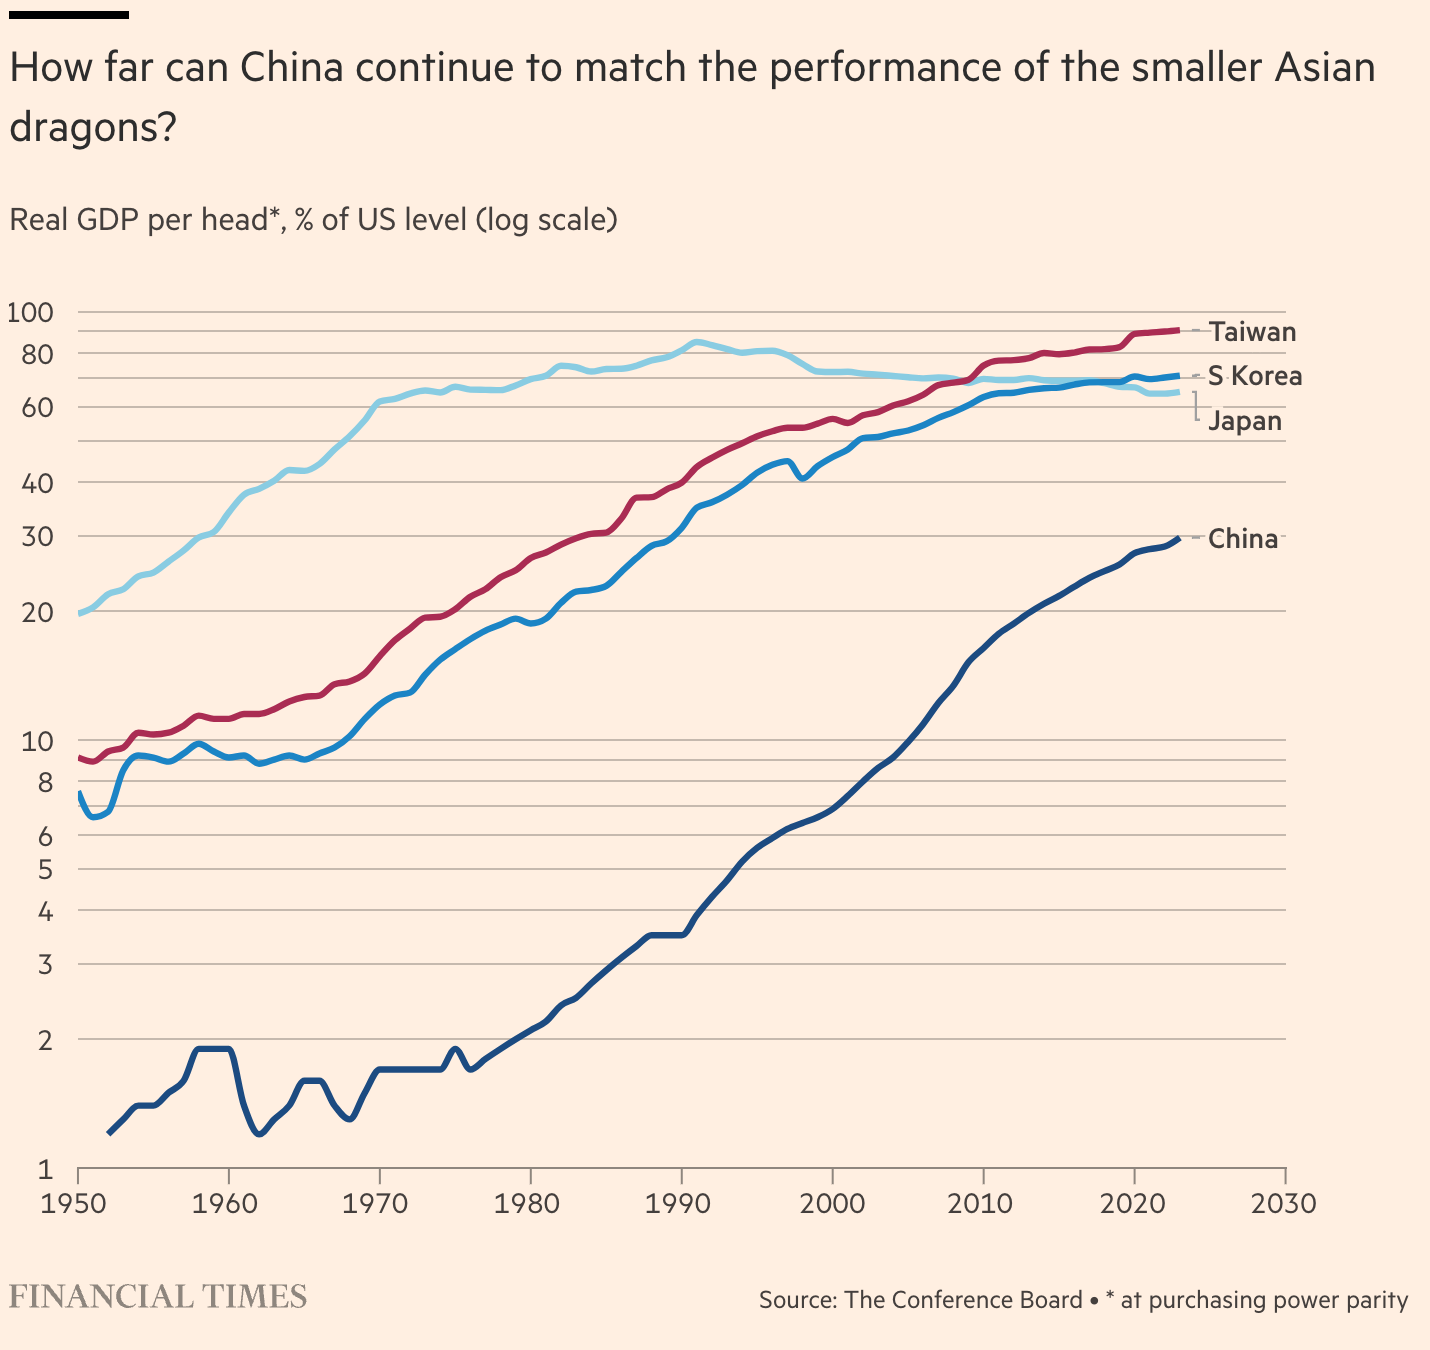
The FT article also states that its many strengths could help it close the GDP gap from those other countries. Strengths that include “the fact it graduates 1.4 million engineers per year, has the world’s busiest patent office, a highly entrepreneurial population, and has world leading potential in electric vehicles. ”
This doesn’t only concern China’s stock market. Just as important are companies for which China has been a key growth driver. These include companies like Tesla , Apple , and Nike .
If China’s economy stabilizes and consumer spending continues to improve, it could offset a slowdown elsewhere.
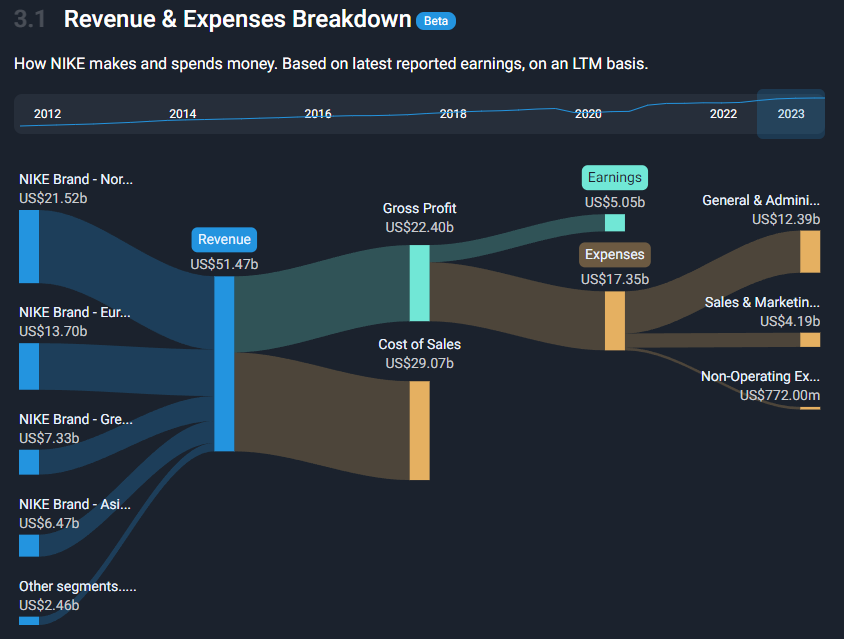
Companies report segment revenue in different ways, sometimes by product and sometimes by region. Either way they report you’ll be able to see the revenue breakdown on the Sankey chart in Section 3.1 of the company report for each company. You can also see how the breakdown has changed over time by scrolling horizontally over the dates at the top of the chart.
This is what it looks like for Nike, and you can see that from 2012 to 2022, Nike’s revenue from “Greater China” has increased from 10% of revenues to 14%:
Now, let’s have a look at bond ETFs.
⚖️ The Pros And Cons Of Bond ETFs
Some prominent investors believe we are close to a peak in bond yields.
Bill Ackman said he has covered his short position in bonds , while ‘Bond King’ Bill Gross also says it's time to stop betting against bonds . A lot of Bills talking about bills if you ask us!
Their reasoning has as much to do with a potential recession 📉 (which could make bonds a safe haven again), as it does with the potential for rate cuts ✂️ .
Regardless of whether they are right or wrong, bonds are now offering better yields than they have in nearly 20 years. Their returns may have been terrible over the last two years, but the risk-reward balance is now very different.
For most investors, bond ETFs are a simple way to invest in bonds, including bonds issued by governments, municipalities, or companies. But there are a few nuances to understand.
Before we look at bond ETFs, a quick primer might help with the basic concepts if you are new to bonds. We are going to keep things simple and avoid the actual mathematics - but if you want to get into that you can find all the formulas here .
Coupon, Yield-to-Maturity And Price
A bond can be considered as a type of tradable loan . Bonds have:
- A face value , also known as the par value, which is the amount to be paid back at maturity .
- A maturity date , which is the date when the face value is paid to the bondholder .
- A coupon , which is the interest rate paid each year to the bondholder . The coupon is expressed as a percentage of the face value.
Bonds can be quoted and traded by YTM (yield to maturity) or price, where:
- Price is the percentage of the face value, and
- YTM is the approximate yield if the bond is held to maturity.
- The yield typically differs from the coupon.
Bond prices and yields are inversely related, so the price falls when the yield rises and vice versa . We can use a US 10 year treasury example to explain why this is:
- This bond matures in August 2033 and pays a 3.875% coupon.
- At the time of writing, this bond was trading at a price of 91.7 (ie. 91.7% of its par value), and because of this, it offered a yield to maturity of 4.95%.
When rates rise, investors demand higher yields. Sellers therefore have to offer bonds at a discount, thereby increasing the effective yield. The yield on a discounted bond actually increased for two reasons.
Using the example above, if you are paying 91.7% of the face value of the bond, and you hold it to maturity you will receive the full face value. So you will earn 8.3% over 10 years, or roughly 0.83% per year.
You’ll also earn a 3.875% coupon on the face value each year. But because you only paid 91.7% of that face value, your annual yield is 3.875% of 91.7, which is 4.21%.
The yield to maturity for a bond includes both the capital gain (or loss) and the effective annual yield. However it also assumes that coupons are reinvested at the same rate, so it’s really an approximation.
If you buy a bond, you can ‘lock in’ the YTM, assuming the issuer doesn’t default . However the price will continue to fluctuate. So, if you sell it prior to maturity you will make a profit or loss depending whether yields are higher or lower than when you bought it.
Duration
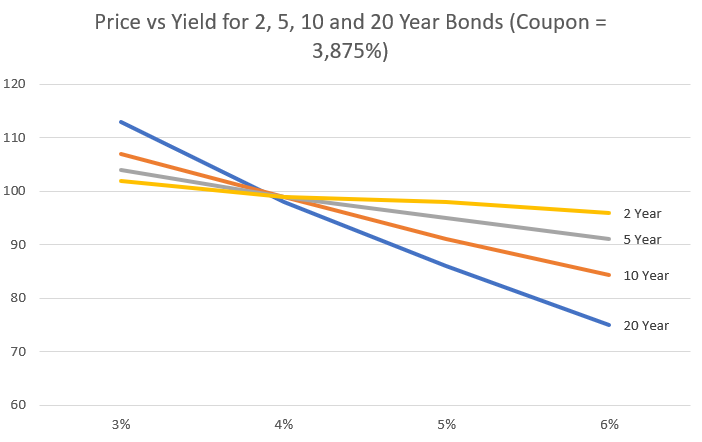
In the above example, if the yield rises to 5.95%, the price will fall to 84.7. If the yield falls to 3.95%, the price will rise to 99.39. So for this particular bond, a 1% change in yield results in a price change of about 7%.
Duratio n is a measure of the sensitivity of a bond's price to changes in yield. Check out this calculator if you want to experiment with the sensitivity yourself or learn more about the concept.
While it’s expressed in years, it also approximates the change in price for a 1% change in yield. So longer dated bonds are far more sensitive to changes in yield. The graph below reflects the change in the prices of bonds with a 3.875% coupon and 2, 5, 10 or 20 years until maturity.
If you plan to hold a bond to maturity, duration doesn’t really matter. But if you might sell that bond earlier, its duration gives you an idea of the interest rate risk.
And all this matters if you are investing in bond ETFs.
Bonds vs Bond ETFs
As mentioned, if you hold it to maturity you are locking in a particular yield, regardless of what happens to the price between now and the maturity date.
❗But this isn’t necessarily true for bond ETFs. Why? Well most bond ETFs that exist today are perpetual investments.
They target a specific range of maturities and then continuously roll positions into new bonds when the time to maturity falls below the lower end of the range.
If a bond ETF is perpetual, the yield and price will both keep fluctuating in line with the part of the yield curve they are exposed to. This doesn’t make them a bad investment, but it could result in a loss if you need to sell them after a period of rising yields.
As an example, these are the average durations for some of the largest bond ETFs:
- Vanguard Total Bond Market ETF (BND) : 5.6 years
- iShares Core U.S. Aggregate Bond ETF (AGG) : 5.9 years
- Vanguard Total International Bond ETF (BNDX) : 7.1 years
- iShares 20+ Year Treasury Bond ETF (TLT) : 16.3 years
Target Maturity Bond Funds
Until recently global bond yields had been trending lower since long before ETFs existed. That meant ETF investors benefited as prices kept rising. Now that rates seem to be normalizing, investors are looking for more certainty.
ETF issuers have responded by launching more target maturity bond ETFs . These funds hold a portfolio of bonds with maturities in a single year. As the bonds mature, the principal is paid to fund holders, and then the fund closes down.
This allows you to ‘lock in’ the yield - well kind of: the actual yield will depend on the rate at which you can reinvest dividends.
Here are two examples of target maturity ETFs that hold corporate bonds:
💡The Insight: A Few More Risks To Keep In Mind
Target maturity funds remove some of the uncertainty which may help if you want to take advantage of higher yields. But regardless of whether you decide on a ‘standard’ or target maturity ETF, there are two other risks to keep in mind:
-
The first is the default risk . Like any investment, higher returns tend to mean higher risk. Fortunately ETFs offer some diversification - but funds that hold bonds with lower credit ratings still carry more risk.
-
The second risk, which is often overlooked, is liquidity . If a fund invests in a very specific part of the bond market, it may struggle to buy and sell bonds that fit its mandate. This can result in the fund underperforming the benchmark it’s supposed to be tracking. This gets even worse if the fund faces large redemptions and becomes a forced seller in an illiquid market.
-
⭐To avoid this, stick to funds that invest in big, liquid markets.
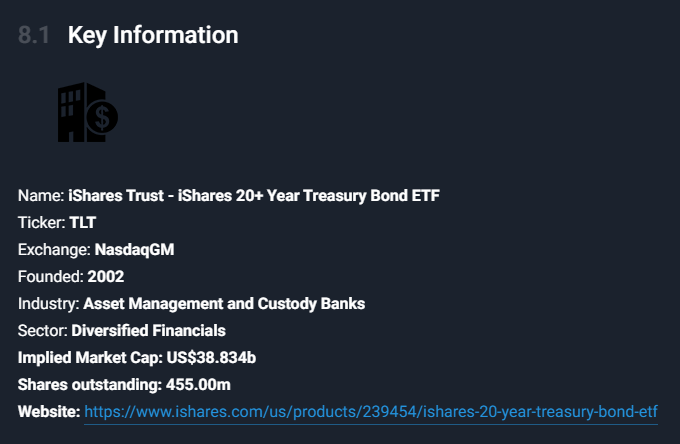
You can find the average duration for a fund’s holdings, as well as credit ratings, the tracking error and liquidity metrics on a fund’s fact sheet 📄.
In most cases, you’ll be able to access the factsheet from the Simply Wall St dashboard by typing in the ticker and then heading to section 8.1: Key Information.
So before investing in bonds, just remember, as interest rates rise, bond prices go down. As interest rates go down, bond prices rise.
What Else is Happening?
First a recap of the key data releases we mentioned last week…
- 🇬🇧 The UK’s unemployment rate remained at 4.2% .
- 🇦🇺 Australia’s inflation rate was 5.4% in the year to Septembe r.
- This was lower than August’s 6%, but higher than the 5.1% expected.
- Australia joins the list of countries finding inflation at a stubborn level and the odds of a rate hike in November has now increased according to the futures market.
- 🇨🇦 Canada’s central bank kept interest rates steady at 5% .
- The bank’s press release stated that “ there is growing evidence that past interest rate increases are dampening economic activity and relieving price pressures .”
And then, a few news items that we thought were worth noting…
- ☁️ Quarterly results from Microsoft and Alphabet reflected differing fortunes from the cloud computing segments.
- Revenue for Microsoft’s Azure platform increased by 29% in the last year, up slightly from the previous quarter. Revenue growth at Google Cloud slowed to 22%, well below consensus estimates.
- Microsoft’s performance was boosted by its AI offering in partnership with OpenAI.
- When OpenAI launched ChatGPT nearly a year ago all the focus was on what it meant for Google search.
- To see the current investors’ narratives on Alphabet and Microsoft , checkout their respective company reports!
- 🏦 The US Fed’s FOMC (Federal Open Market Committee) will meet next week to set the Fed Funds Rate.
- Fed Fund futures are implying a 98.8% chance that the target range will be kept 5.25-5.50%. Talk about a sure thing 😅
- Interestingly, they now imply a 1.2% chance of a 0.25% rate cut, and no chance of a hike .
- Fed officials have already suggested that the next hike would only be in December, but a growing number of economists believe we’ve seen the last hike. In fact Fed officials are beginning to agree . Just keep in mind, as the data changes, so too will their decisions.
Key Events During the Next Week
It’s a big week for economic data, headlined by the Fed rate decision on Wednesday.
In Europe inflation and GDP data is due on Monday and Tuesday for Germany and France. The UK’s central bank will announce its interest rate decision on Thursday.
In Asia, China’s manufacturing data is due on Tuesday and Wednesday, while the Bank of Japan will announce its interest rate decision on Tuesday.
In the US, the ADP employment report and the JOLTs Job Openings report are due on Wednesday, and then non-farm payrolls and the unemployment rate will be published on Friday.
Third quarter earnings season continues with lots of prominent companies reporting. Including:
- McDonald’s
- Pfizer
- AMD
- Amgen
- Caterpillar
- BP
- Qualcomm
- Airbnb
- PayPal
- Apple
- Eli Lilly
- Shell
- Starbucks
- Berkshire Hathaway
Have feedback on this article? Concerned about the content? Get in touch with us directly. Alternatively, email editorial-team@simplywallst.com
Simply Wall St analyst Richard Bowman and Simply Wall St have no position in any of the companies mentioned. This article is general in nature. We provide commentary based on historical data and analyst forecasts only using an unbiased methodology and our articles are not intended to be financial advice. It does not constitute a recommendation to buy or sell any stock and does not take account of your objectives, or your financial situation. We aim to bring you long-term focused analysis driven by fundamental data. Note that our analysis may not factor in the latest price-sensitive company announcements or qualitative material.

Richard Bowman
Richard is an analyst, writer and investor based in Cape Town, South Africa. He has written for several online investment publications and continues to do so. Richard is fascinated by economics, financial markets and behavioral finance. He is also passionate about tools and content that make investing accessible to everyone.
