
What Happened in the Market This Week?
Market Insights for week ending 30th September
As Split Enz once put it - “ I see red, I see red, I see red .”
It was yet another red week for equity markets. Most indices fell below their June lows, trading at levels last seen in November 2020 . Energy stocks were worst affected as the oil price fell below $80 - however, the selling was broad-based and only the healthcare sector came out of the week ending in green.
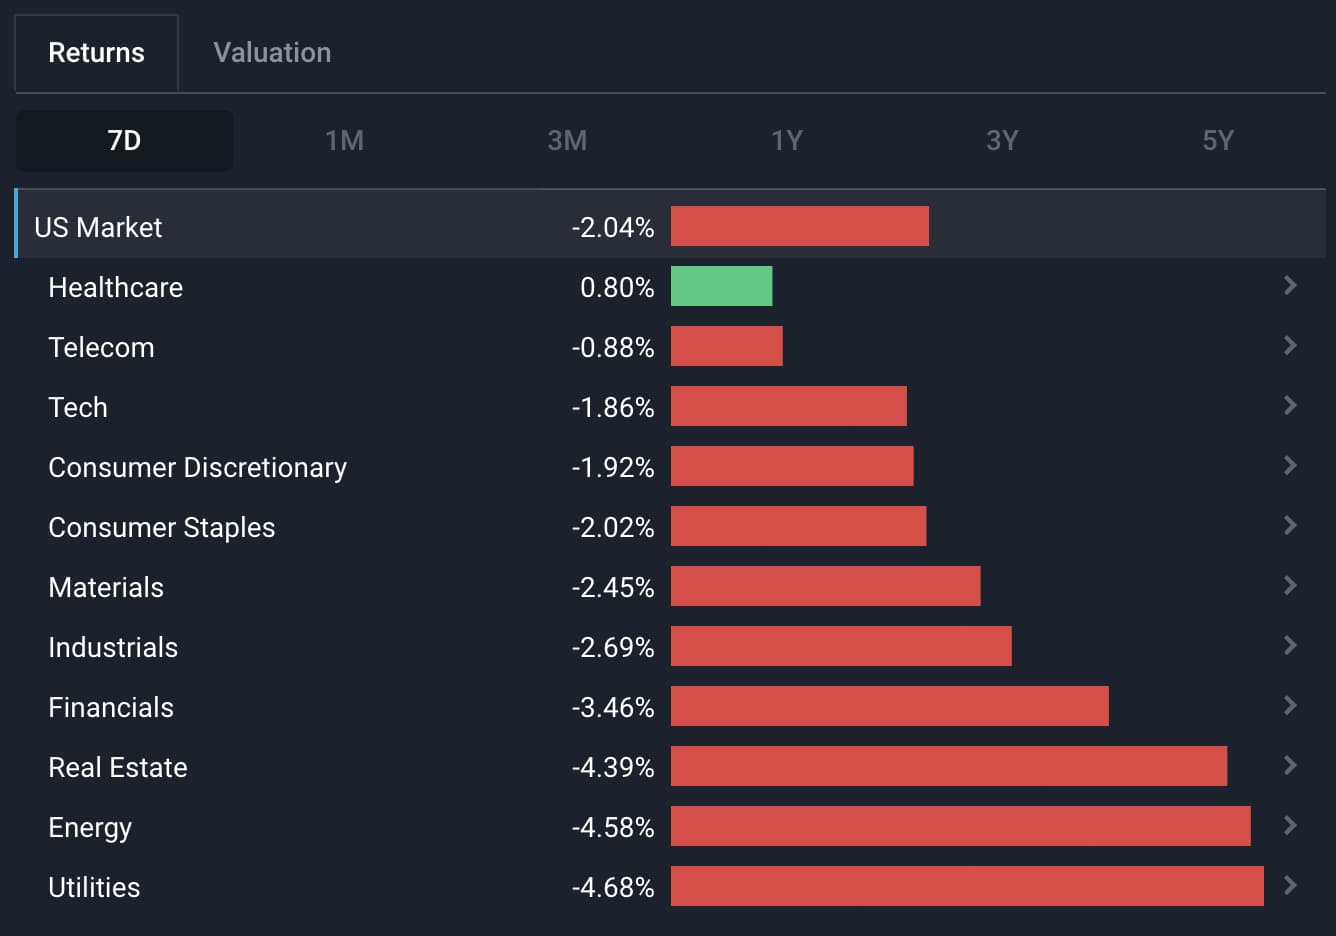
U.S. Sector 7D Performance - 30th September 2022 - Simply Wall St
Some of the developments we have been watching over the last week include:
- The U.K. stock market, currency and bonds are being hammered as markets rejected the new government’s growth plan.
- We also had a look at some of the positive news in the stock market that’s been lost amongst all the negative news .
Investors Turn Bearish on the British Economy 🇬🇧
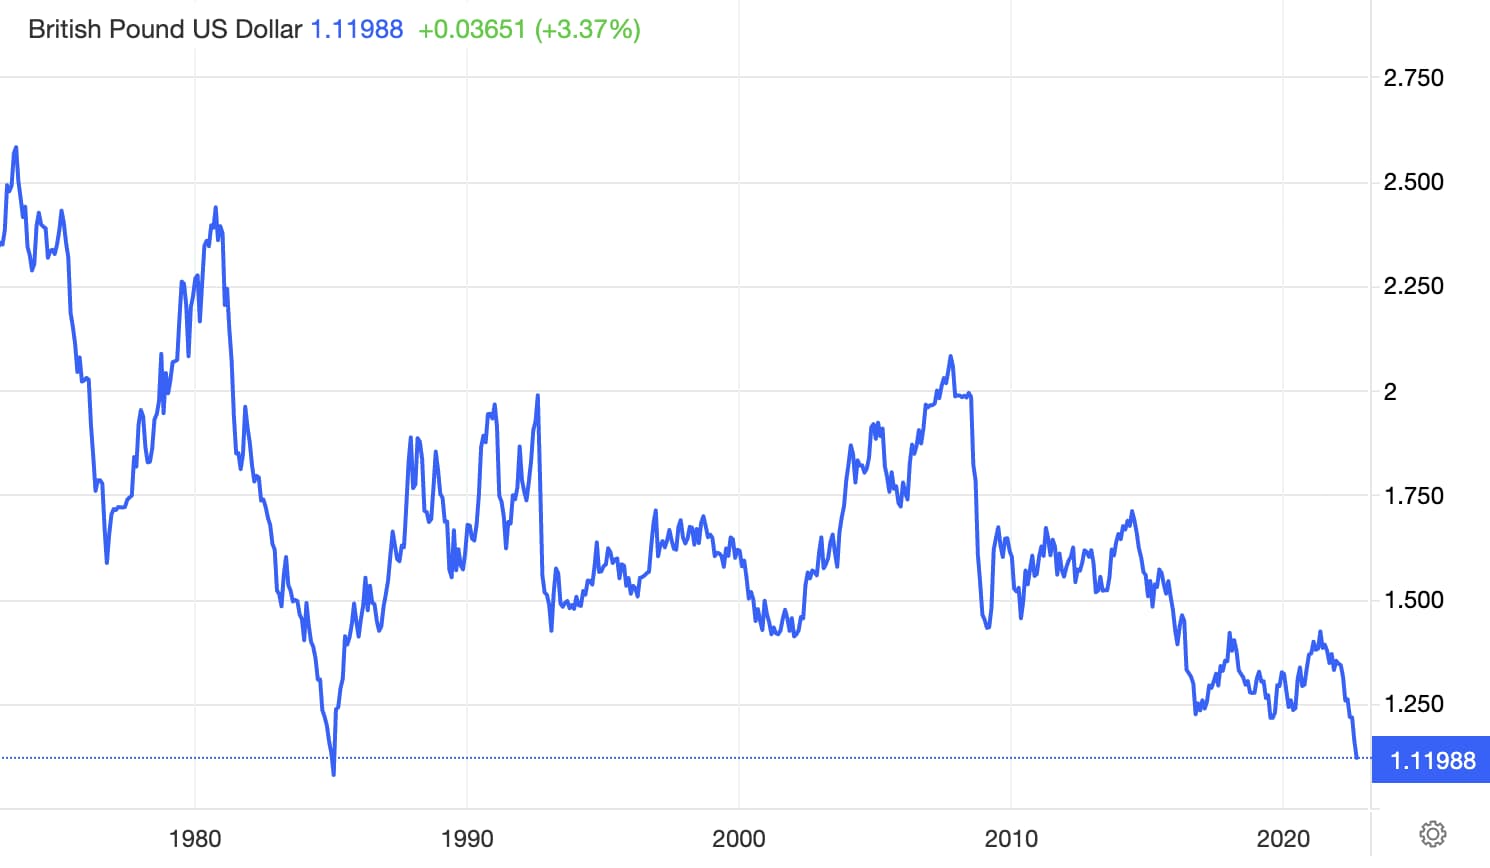
The U.K. economy was thrown into more turmoil last week as markets rejected the new government’s plan to reignite growth while inflation remains at 40-year highs. Investors' lack of faith was reflected in the currency, bond yields and market valuations. The British Pound (£) briefly touched a new record low of $1.035 USD on Monday , bond yields rose to 4.5% (up from 3.25% last week) and the U.K. market declined more than 3.5% in the past 7 days.
Why has the British Pound dropped?
The selloff in U.K. markets started after the U.K.’s new Chancellor of the Exchequer, Kwasi Kwarteng, announced the U.K.’s biggest tax cuts in 50 years, along with plans to increase government spending and borrowing.
These tax cuts of £45 billion aren’t a free lunch however, and investors know it. The government will have to borrow to make up the difference which will increase the budget deficit which was already forecast to be around £128 billion, or 5.4% of GDP this year. Add to that a trade deficit of around £9 billion a month, and we have growing, twin deficits which typically lead to a weaker currency.
The U.K.’s Monetary vs Fiscal Conundrum
The situation in Britain is unique - somewhat confusing and to many might appear illogical.
On the one hand, you’ve got the Bank of England raising rates to reduce inflation (monetary policy), and on the other the government is now cutting taxes and increasing borrowing to stimulate growth (fiscal policy) . Two completely contradictory measures by two different bodies.
The government’s fiscal policy actions could ultimately lead to more inflation. The weaker currency due to the tax cuts means imports will cost more, leading to higher inflation. At the same time, higher interest rates mean the government is paying more to borrow - as are consumers and businesses.
Liz Truss and Kwasi Kwarteng appear to be betting that their plan will stimulate growth via investment more than via consumer spending. They may be hoping that this will restore confidence in the long-term potential of the U.K. economy and result in investments with a longer time horizon. If their plan goes well, this could create a virtuous cycle where money flows into the economy chasing growth potential, thus leading to a recovery for the currency.
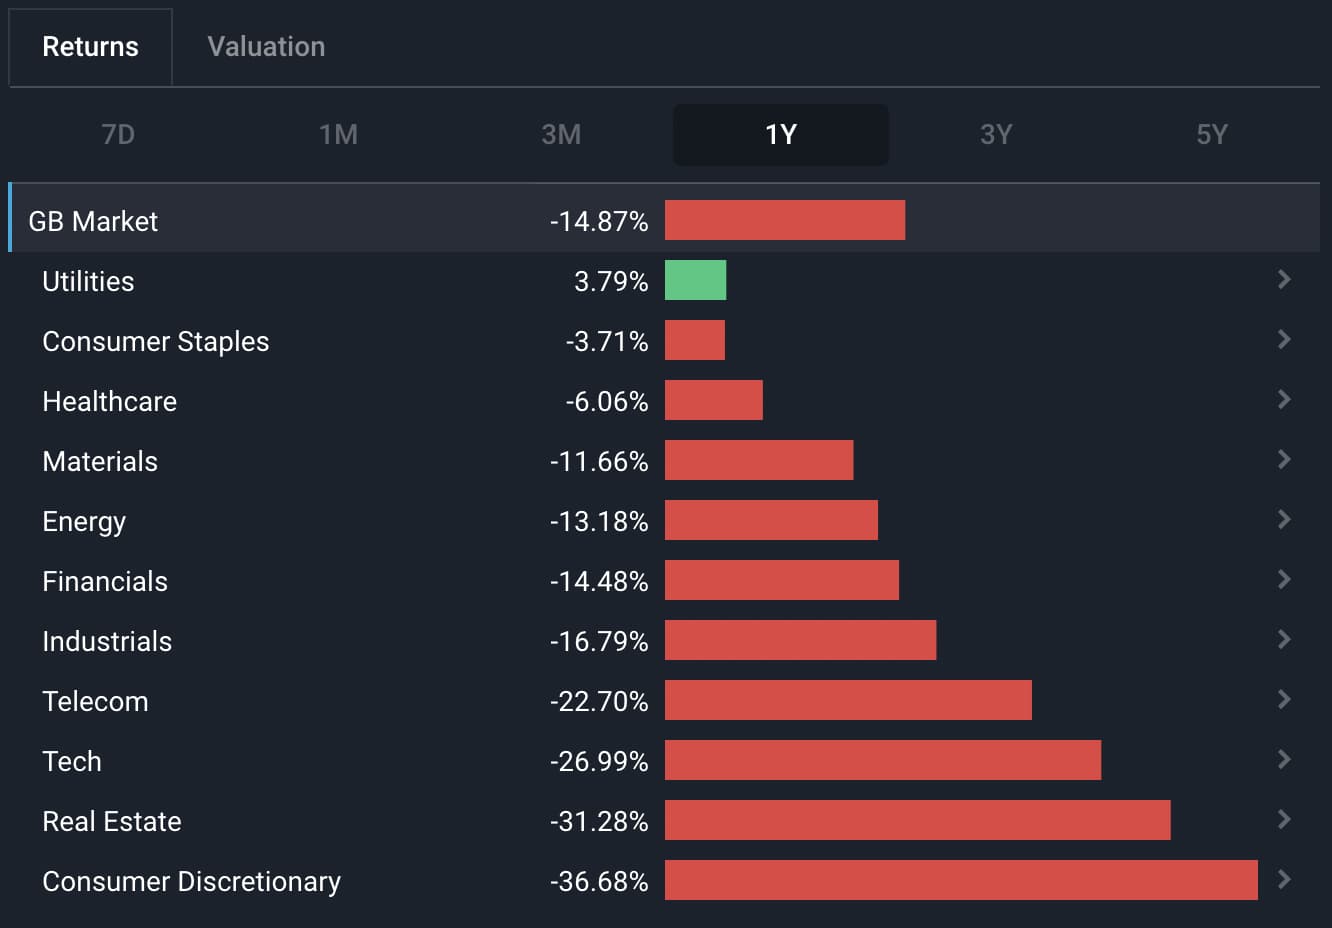
U.K. Market's Returns over 1Y - Image Credit: Simply Wall St U.K. Markets Page
Bank of England Responds by Buying Bonds
The BoE responded to the crisis swiftly by announcing that it would buy £65bn worth of bonds in the open market . By buying bonds the bank hopes to put a ceiling on bond yields, provide liquidity to the financial system, and restore confidence.
The BoE was due to begin a quantitative tightening program by selling the bonds it previously bought. It has now been forced to make a complete u-turn and begin another quantitative easing program.
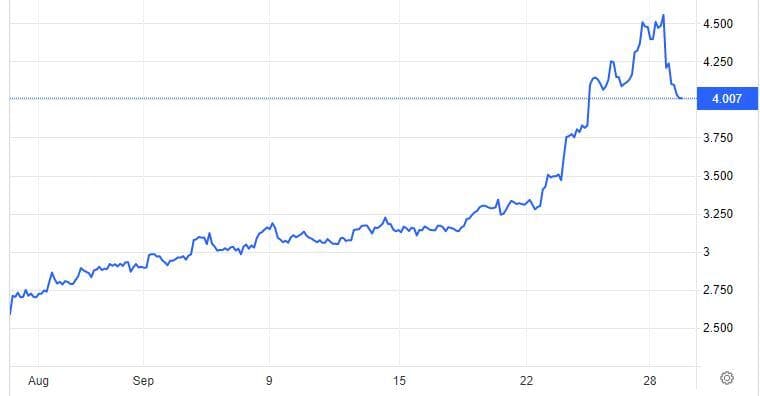
The chart below shows how the U.K. 10-year government bond yields rose from 3.25% to 4.5%, (an increase of 1.25%) after the Chancellor’s plan was announced on 23rd September - and then how they fell back to 4% as soon as the BOE announced that it would be buying bonds just three days later.
💡 The Insight: The U.K. Economy’s Outlook
The outcome of the U.K.’s growth plan will have a lot to do with what happens outside of the country as well. If global inflation recedes and the global economy experiences a soft landing, it may work. But a hard landing or persistent inflation elsewhere could lead to stagflation with a deeper recession.
There is a competitive element to this strategy. If the global economy turns a corner soon, the U.K. could be better positioned, on a relative basis, as an investment destination.
Will it work? The market clearly has its doubts, but time will tell.
For Short or Medium-Term Investors (< 5 years)
Just two weeks ago, we mentioned that it’s the U.K.’s smaller, locally focused companies that are most exposed to the country's economic problems . The larger companies ( think Rio Tinto LSE:RIO or Anglo American LSE:AAL ) tend to earn revenue around the world, and those revenues increase in local currency terms when the Pound weakens. As long as the GBP remains in a downtrend, this is likely to remain the case.
For Long-Term Investors (5+ years)
It’s too early to know if the U.K.’s growth plan can or will work. But if it does, the environment for the shares that have fallen the most could change completely. This may not be the time to act, but it is a good time to try to work out which those companies will benefit if the plan attracts the investment flows Liz Truss hopes it will.
The Stock Market is not all Bad News! 🥳
To avoid going into a depressive spiral, we want to give some of the positive news some airtime. There’s a lot of bad news around, but if you look in a few places there’s a few positive stories too.
S&P 500 Profits are at Record Levels
While equity prices are close to two-year lows, corporate profits are actually at record highs. Second quarter earnings, for companies in the S&P 500, weighted by the index weights, added up to 57.95 index points. That compares to 54.83 in the first quarter , which at the time was already a record!
As it stands today, analysts are expecting a slight decline for Q3 profits, but the fourth quarter is actually expected to be another record (albeit only 0.04 points above Q2’s record earnings ). However, forecasts are beginning to fall as we continue to get new information, and may fall faster if third quarter earnings end up disappointing investors.
Investor sentiment is at a bearish extreme - which is often a bullish sign
On 21st September, the AAII Sentiment Survey , which is a survey showing where investors see the market going in the near future, recorded that 60.9% of respondents expected equity markets to decline over the following six months . The same survey recorded 17.7% of respondents as bullish and 21.4% of respondents as having a neutral view.
This survey is conducted by the American Association of Individual Investors, so most of the respondents are U.S. retail investors. At 60.9%, the percentage of bearish respondents was the third highest it’s been since the survey started in 1987. It’s only been higher in October 1990 and March 2009. The interesting thing is, the S&P 500 index rose 27% and 52% respectively during the six months following those occasions in the past.
On most occasions when more than 50% of respondents were bearish, equities rose over the next six months. This might cause you to be subsequently bullish, but there’s a catch. During prolonged bear markets, bearish readings sometimes precede bear market rallies rather than a sustained bull market. This happened in the 2000 to 2003 period, during 2008, and in June this year. Just remember, historical facts aren’t enough to make an investment decision, and forecasting market movements is notoriously difficult (and we don’t advise it).
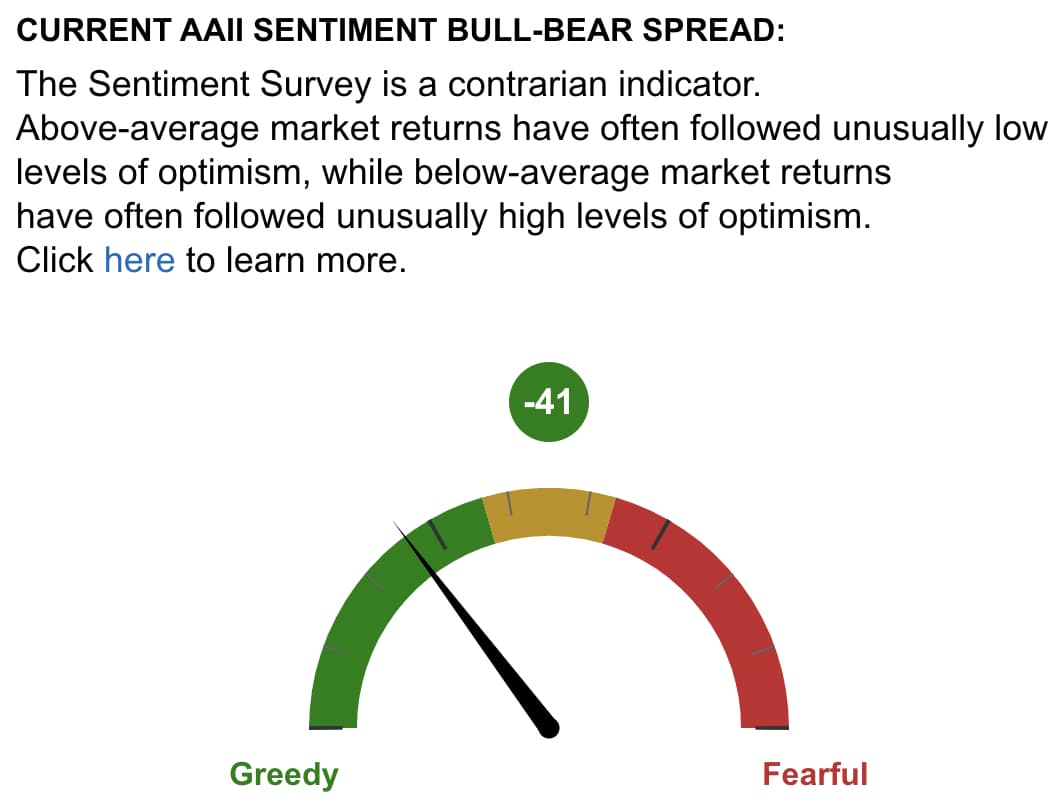
AAII Sentiment Bull-Bear Spread as at 30th September - Image Credit: AAII
Oil price falls below $80 🛢️
Remember when oil was briefly $120 per barrel in March? Well thankfully, it’s fallen a bit since then. The price of crude oil fell below $80 which bodes well for the inflation outlook. Historically, the zone between $75 and $85 has been an important psychological level. Sharp rallies have begun above this range, and sharp declines have begun just below it.
A larger decline in the oil price would dampen inflation expectations substantially - although it would also probably signal that investors were becoming more bearish on the economy.
💡 The Insight: See Both Good and Bad
It’s always a good idea to keep an eye on positive news when the general narrative is bearish, and negative news when the narrative is bullish. Markets are forward-looking and often make lows before the news flow changes. In this case, we have three pieces of positive news, but they all come with caveats, so the key is to remain cautious.
Key Events Next Week
Next week is the first week of the fourth quarter (Q4), and there is some key data out on Friday which is relevant for inflation.
On Tuesday, Australia ’s interest rate decision will be announced . Expectations are for a 0.5% rate rise, following the Fed's recent 0.75% increase.
On Wednesday, the U.S. balance of trade data is being published, while Friday will see the release of U.S. employment data. This includes the unemployment rate, non-farm payrolls and average hourly earnings , and are all important metrics to show whether the interest rate increases have affected labor.
Feels like yesterday only we were talking about Q2 earnings season, and yet Q3 quarters earnings is only 2 weeks away!
Next week, Constellation Brands ( NYSE: STZ ), Levi Strauss ( NYSE: LEVI ), Tilray Brands ( NASDAQ: TLRY ) are leading the pack releasing their Q3 earnings earlier than the rest.
Until next week,
Invest Well,
Simply Wall St
Have feedback on this article? Concerned about the content? Get in touch with us directly. Alternatively, email editorial-team@simplywallst.com
Simply Wall St analyst Richard Bowman and Simply Wall St have no position in any of the companies mentioned. This article is general in nature. Any comments below from SWS employees are their opinions only, should not be taken as financial advice and may not represent the views of Simply Wall St. Unless otherwise advised, SWS employees providing commentary do not own a position in any company mentioned in the article or in their comments.We provide analysis based on historical data and analyst forecasts only using an unbiased methodology and our articles are not intended to be financial advice. It does not constitute a recommendation to buy or sell any stock and does not take account of your objectives, or your financial situation. We aim to bring you long-term focused analysis driven by fundamental data. Note that our analysis may not factor in the latest price-sensitive company announcements or qualitative material.
Richard Bowman
Richard is an analyst, writer and investor based in Cape Town, South Africa. He has written for several online investment publications and continues to do so. Richard is fascinated by economics, financial markets and behavioral finance. He is also passionate about tools and content that make investing accessible to everyone.

