
What Happened in the Market Last Week?
You’d be forgiven for feeling a bit of Deja Vu this past week since the Fed raised rates again by 0.75% for the 4th consecutive time this year. Add to that the heavy selling in some big name tech stocks, and you might be feeling even more Deja Vu, but of the Dotcom bust variety.
While the rate increase came as no surprise, the accompanying commentary gave the market mixed messages, which definitely contributed to the volatility. You may recall the importance of the Fed’s commentary from our prior piece covering how they choose their wording wisely.
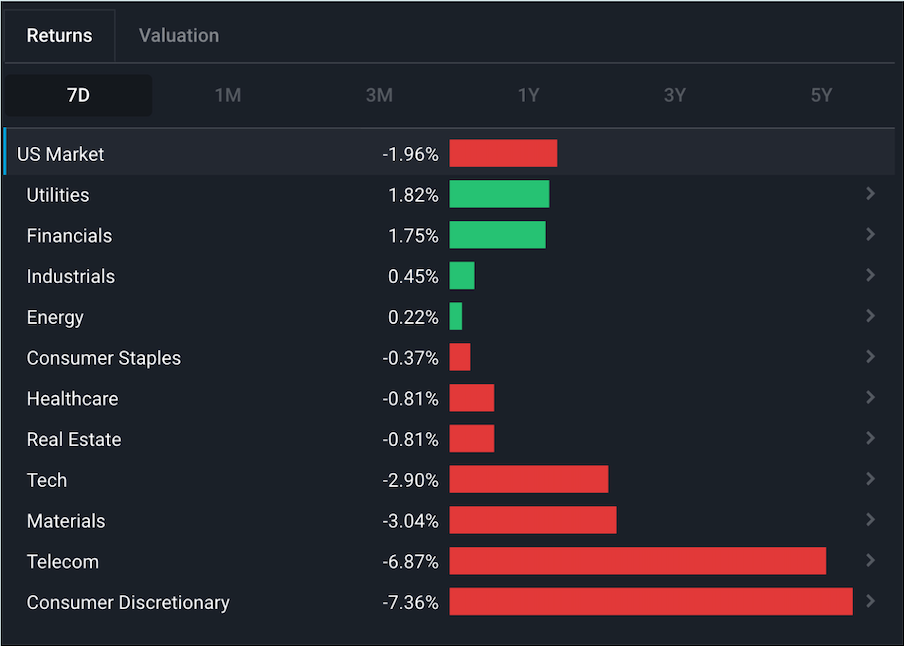
The latest commentary gave hints that the pace of hikes could slow, however there were also indications that the inflationary data was still ‘hot’ . With that kind of inconclusive commentary, investors opted to take some money off the table in rate sensitive industries like the tech, communications and consumer discretionary sectors. Meanwhile energy, industrials and financials faired better since the latest jobs data suggested the economy was still strong.
While plenty has happened over this last week, we’re going to dive into just one topic:
- Many tech stocks, big and small, have been hammered over the last year, and investors are wondering if this is a repeat of the Dotcom bust of the early 2000’s.
There’s plenty to unpack here, so let’s dive in.
Is this a Dotcom Crash 2.0?
The performance of tech stocks over the last few years draws obvious parallels with the Dotcom bubble and bust 22 years ago.
Here’s why:
- In the five years to March 2000, the Nasdaq Composite index rose 489% , and then it fell 75% over an 18 month period.
- In the five years to November 2021 the same index appreciated by 205% , and it’s since fallen as much as 35% .
Now, the numbers aren’t quite as big, but then again, the index heavyweights of today are more mature and profitable companies compared to the heavyweights back then.
Were tech stocks in a bubble at the end of last year?
Depends on who you ask, but most say yes. In short, a bubble occurs when stock prices rise until valuations become divorced from economic reality. The bubble bursts when the market runs out of buyers as reality catches up and the euphoria disappears. It often takes a catalyst like rising rates or corporate bankruptcies to trigger the bust.
Is that what has occurred this time around? Mmm, yes and no. There are actually two groups of companies to consider: large-cap tech stocks and smaller, hyper-growth stocks.
The broader tech sector, which is dominated by large-cap stocks, was trading on a price-earnings multiple (PE ratio) of 40 to 45x through much of 2020 and 2021. Now while that’s high relative to historical price multiples for the S&P 500 index, it’s not totally unrealistic considering the strong earnings growth the largest companies in the index were achieving at the time. It might’ve been justified IF they could sustain the growth. But they couldn’t.
Those indexes peaked in November last year, and have since fallen - first because interest rates began to rise, and more recently because growth is slowing AND costs are rising (which compresses profit margins).
The stocks of smaller, rapidly growing companies are a very different story. Many of these stocks actually peaked more than 18 months ago. Good examples are Zoom Video (Nasdaq:ZM), Teladoc Health (NYSE:TDOC) and Roku (Nasdaq:ROKU), which were all top holdings of the popular ARK ETFs. These stock prices were trading on a price-to-sales ratio (PS ratio) of 30x or more, which was arguably in speculative bubble territory given the growth and risk prospects at the time.
Rising interest rates brought an end to that party - but you could argue valuations were unsustainable to start with. For a company trading at more than 30x sales to deliver a return, it needs to grow sales profitably, and at a high rate for a very long time. It’s not impossible, but few do it, let alone an entire group of stocks.
So it's fair to say that these ‘hyper growth’ stocks were in a bubble and their valuations are being brought back down to earth as reality is setting in and the euphoria subsides. The larger companies are facing an earnings recession, and valuations are being compressed as rates rise and earnings forecasts are re-rated lower. Some companies like Meta (Nasdaq: META) and Amazon (NASDAQ: AMZN) are facing company specific challenges too.
How did we get here?
The way this has unfolded shouldn’t be a huge shock, but here’s a very simplified version:
- We had a decade of super-low interest rates as most central banks tried to stimulate their economies to reach their inflation targets of 2-3%
- On top of that, we have had several new and exciting industries - AI, cloud, automation, SaaS etc - which produced mouthwatering growth rates over a period of five years. Unfortunately though, these things don’t go on forever.
- Then we hit a huge spike in inflation due in part to extensive monetary support to markets and supply chain issues globally.
- Central banks then had to reverse course and try to normalise inflation and reduce consumer demand by raising rates and removing monetary support, which subsequently made money more expensive (higher borrowing rates) and stock valuations less justified (due to higher discount rates).
 The Insight: History doesn't always repeat... but it often rhymes.
It’s important to remember that no business is worth an infinite price, no matter how great its prospects are. The following examples from the fallout from the first dotcom bubble might give us a few ideas of what we could expect going forward.
Cisco vs Nvidia
Parallels have been drawn between Cisco Systems (Nasdaq: CSCO) in 2000 and Nvidia (Nasdaq: NVDA) now. Cisco provided, and still does, some of the key hardware required to build the internet. Between 1998 and 2002, Cisco’s market value ballooned as investors began to realize how big the internet could be, and the company very briefly became the most valuable company in the world. Cue investor euphoria.
Despite the company’s revenue and cash flows increasing by nearly 400% since then, the share price is still lower than its 2000 peak.
Nvidia is now in a similar position. It’s the world’s leading producer of GPUs which are key to cloud computing, AI, virtual reality, automation, blockchain, you name it - pretty much all the growing industries. Since Nvidia’s share price peaked last year, it has fallen as much as 67%, while the price-to-sales ratio has fallen from 34x to 10x. Cisco’s P/S ratio peaked at 49x and then fell to 2x.
This doesn't mean things will play out the same way for Nvidia - but it’s a reminder of what can happen.
Interestingly though, even if you didn’t time the bottom perfectly on Cisco back in late 2002, it has returned roughly 12% per year for nearly 20 years, becoming a steady long-term compounder. This is a great reminder on the importance of valuation and Buffett’s old adage: buy high-quality businesses at a fair price, and then wait.
Amazon’s First Dotcom Bust
This ain’t Amazon’s first rodeo. If we agree that we are witnessing the second dotcom bust, then we should have a look at what happened to Amazon (Nasdaq:AMZN) the first time around, back when it was THE dotcom stock. Back in 2000, Amazon, was six years old and had been publicly traded for three years - much like many of the high-flying tech companies we know 20 years later.
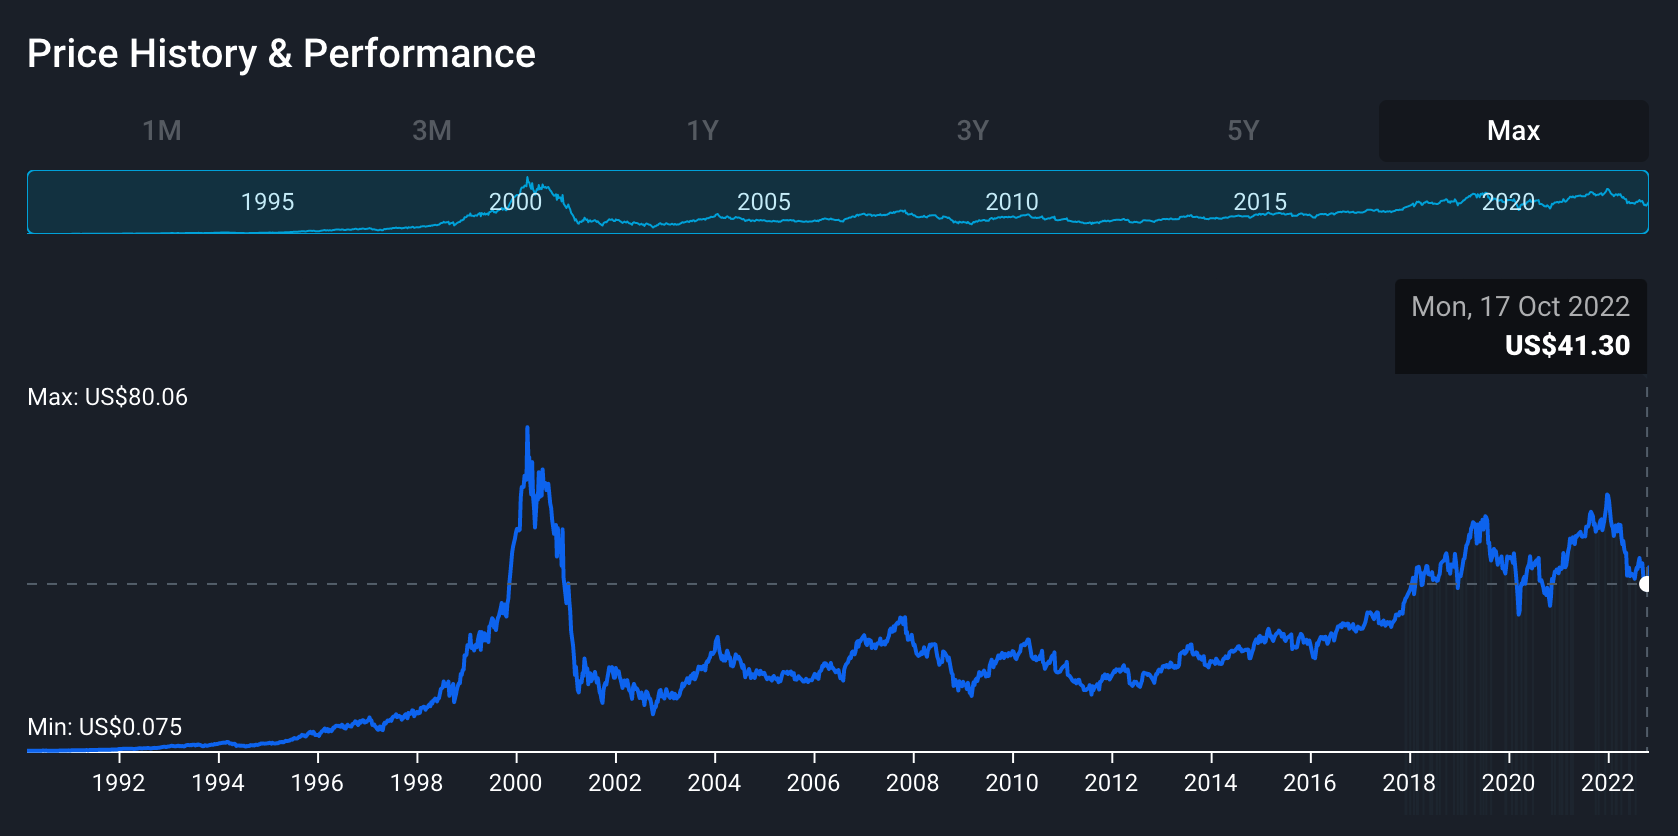
What happened next is well known. Here’s Amazon’s share price from 1998 to 2011 (split adjusted).
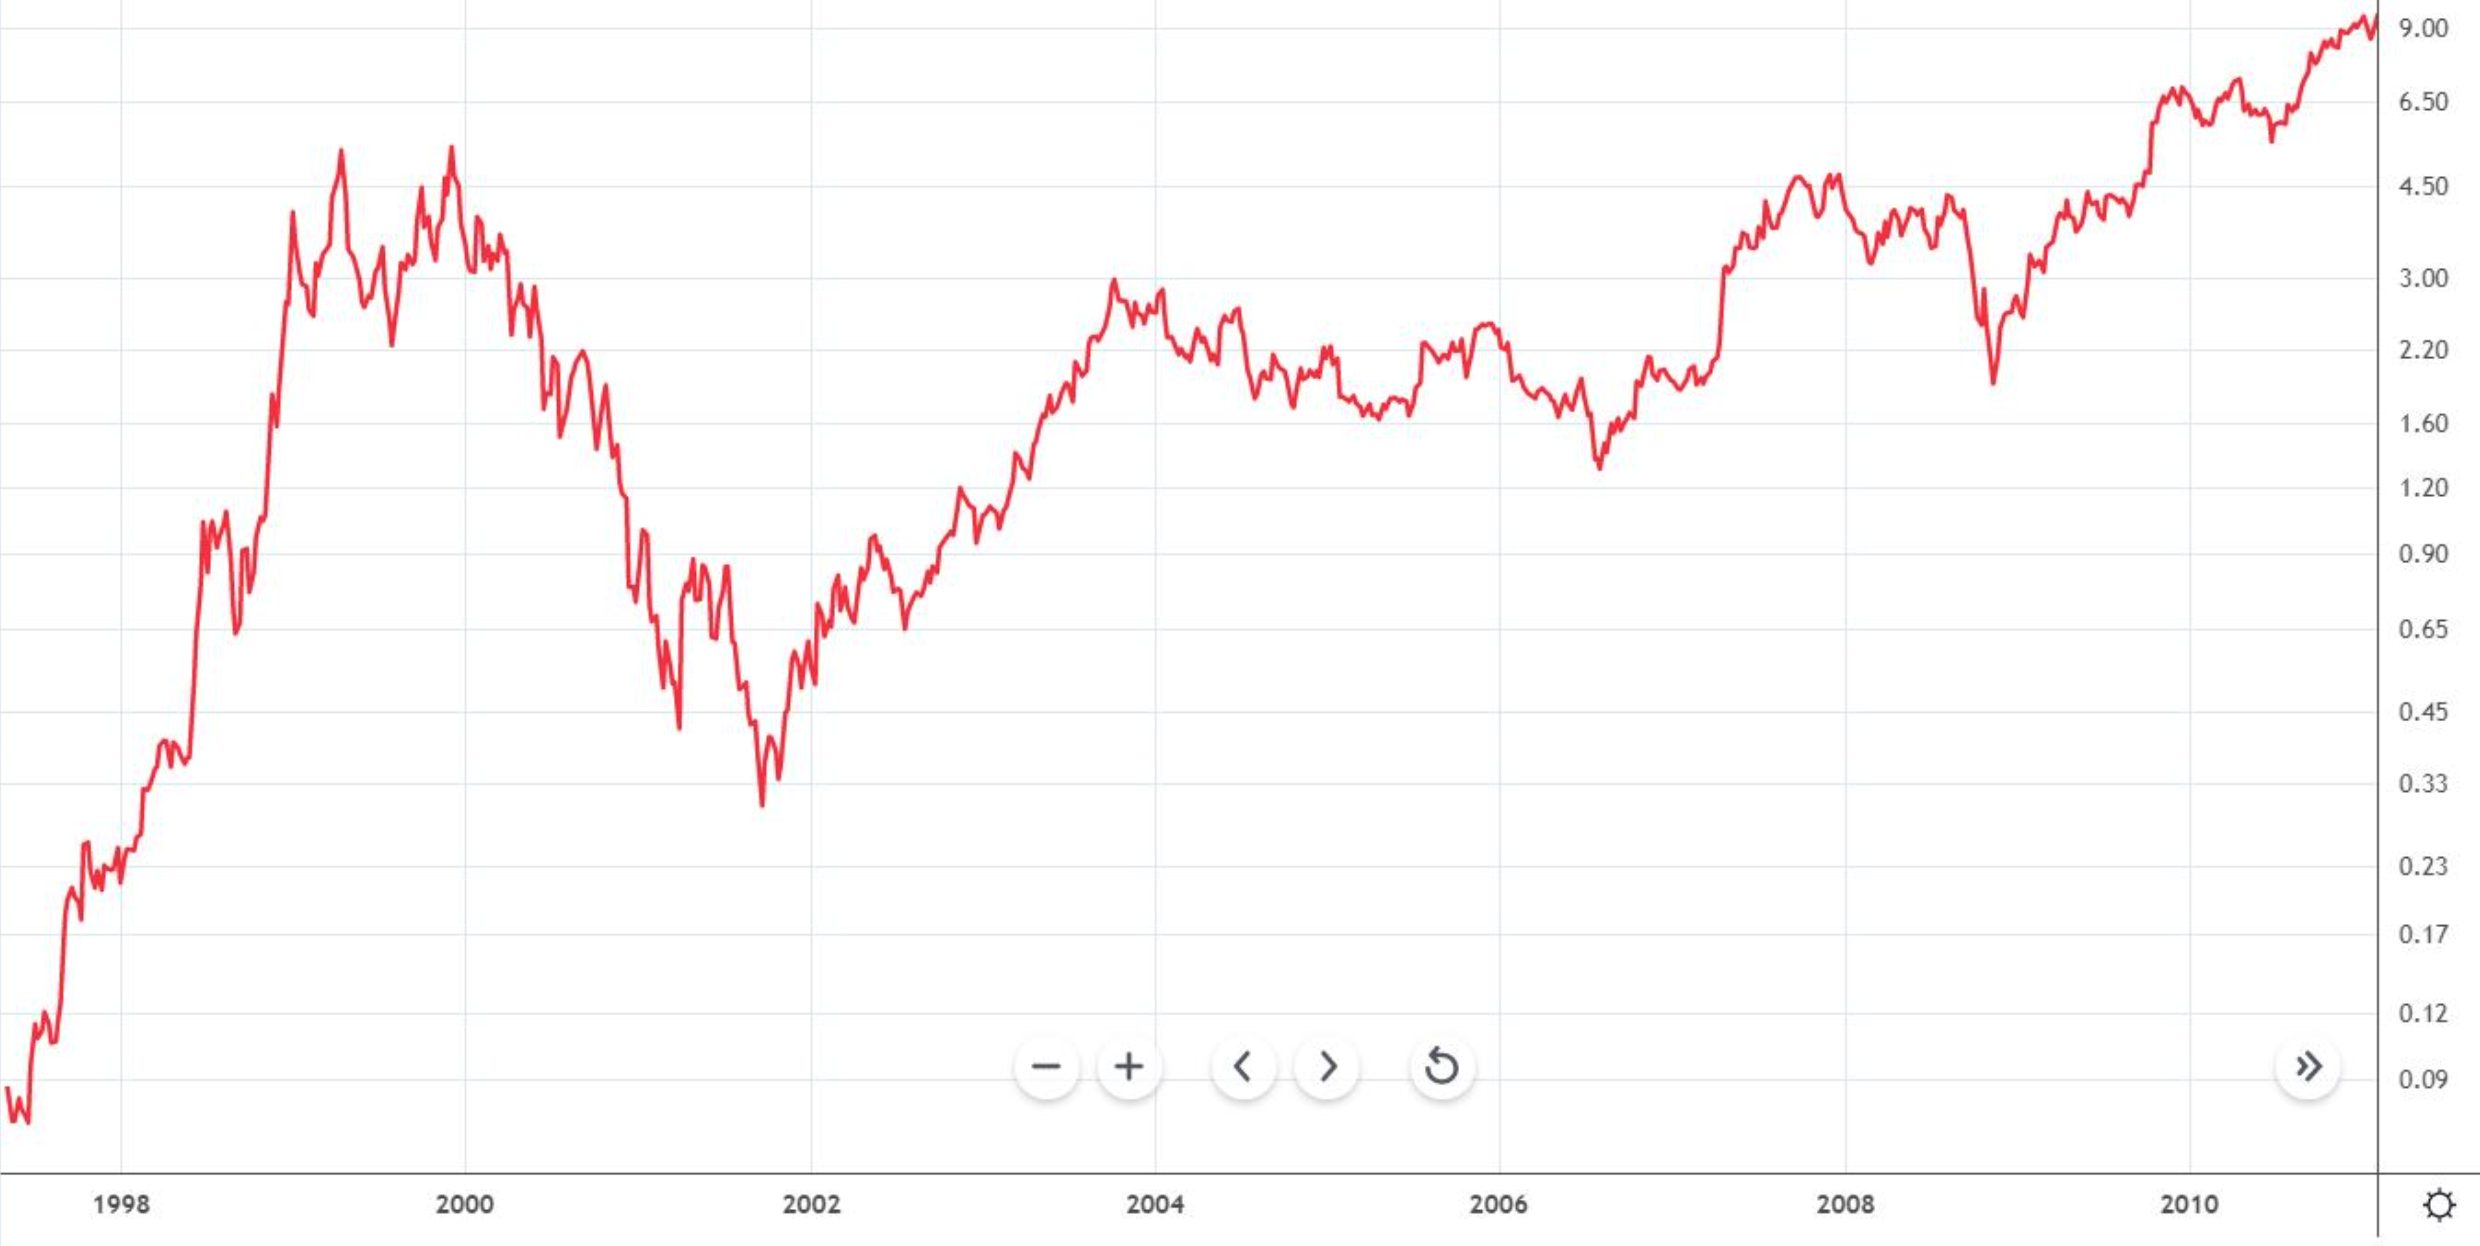
The price peaked at a split-adjusted $5.65 (which was $113 prior to the 2022 20-to-1 stock split) before falling 95% in less than two years. Despite phenomenal business performance following the crash, it didn’t regain its peak price until October 2009.
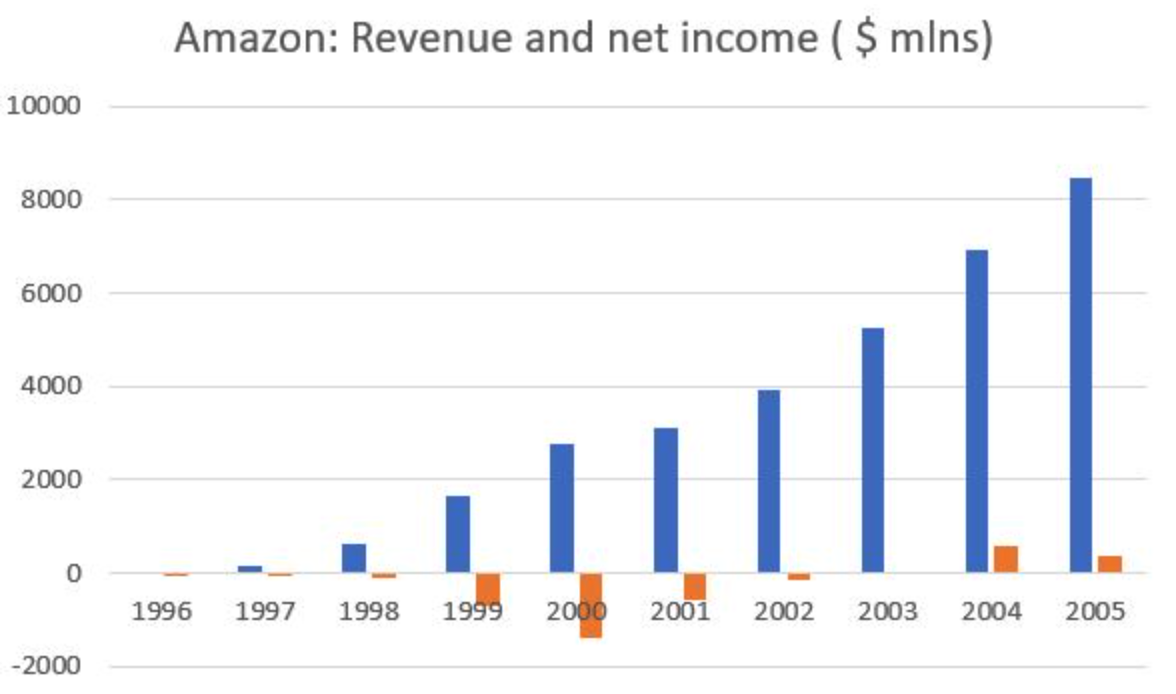
So how did Amazon’s underlying business perform during that period? Quite well actually. Here’s the annual revenue and net income from 1996 to 2005. Revenue rose every year, with only a slight deceleration in 2001. The net loss was slightly wider in 2000, but the margin was similar to the previous year.
An important note: Looking at Amazon entails survivorship bias because most other companies trading on similar valuations didn’t survive the first dotcom crash. But there’s a lesson we can take away if we dig beneath the surface.
In those early days without the scale or profits it has now, Amazon had what others didn’t: a cash cushion. It had just raised $672m in convertible bonds (debt that can be converted into stock) from European markets in early 2000. Despite Amazon’s business metrics improving drastically during the dot com boom and bust , this cash arguably gave it a huge buffer and support it needed to survive the downturn. So when you’re looking at stocks today, be sure to check two things:
- Assess their Financial Health (Like AMZN's for example ) on Simply Wall St . Check if the company's cash balance is enough to last a downturn, and if they have any debt, make sure it's affordable.
- Check the underlying business metrics. If the business is still improving, or still growing, then the large drops in price could provide appealing opportunities to build a position in your portfolio for the long term, provided the valuation makes sense and you understand the business.
Counter-cyclical investing
One of the things that sometimes defines long-term winners is that they carry on investing during bear markets and recessions. Amazon , Alphabet , and Apple laid many of the foundations for their future success by continuing to invest between 2000 and 2005. This doesn’t always work - many of Microsoft’s investments at the same time didn’t work out - but when it does it gives companies a strong edge down the line.
Meta (Nasdaq: META) is doing that right now. However, since the stock is now 75% below its peak, investors appear to be abandoning the stock and questioning the strategy. This excellent article by Ben Thompson looks at why Meta might be doing exactly the right thing at the moment.
The Insights: Key lessons from booms and busts
To summarise this piece, here are a few of the key lessons:
- The most compelling stories can create the most overvalued stocks. If you add low interest rates to the mix, you have the perfect recipe for a bubble. Focus on the fundamentals of the business, and remember no stock is worth an infinite price, no matter how good it is.
- Anchoring bias is something investors need to be careful of. This is the tendency to view recent prices or valuations as ‘normal’ or as targets when prices begin to recover. When a bubble bursts we need to base our expectations on fundamentals and established valuation methods. Stocks that traded at extreme valuations may never regain their all-time highs.
- We also need to be careful about extrapolating trends - and particularly growth trends - into the future. A company’s growth will eventually be constrained by the market it operates in. We can’t really be sure of how big a company’s market will get, so the best we can do is be conservative when we make our estimates of the future.
- What a company does during a downturn can provide clues as to how it might perform in the future. Companies that keep investing are often the ones to keep an eye on.
Key Events Next Week
The key event this week will probably be the US midterm elections on Tuesday.
Apart from that, it's a quiet week for economic data - notable data includes the US inflation prints due on Wednesday and UK GDP data due Friday.
Most of the large companies have reported already, but there are still hundreds of smaller companies due to report, including:
- Lyft (Nasdaq:LYFT)
- Disney (NYSE:DIS)
- Upstart (Nasdaq:UPST)
- Occidental Petroleum (NYSE:OXY)
- Roblox (NYSE:RBLX)
- Unity (NYSE:U)
- Dutch Bros (NYSE:BROS)
- NIO (NYSE:NIO)
Have feedback on this article? Concerned about the content? Get in touch with us directly. Alternatively, email editorial-team@simplywallst.com
Simply Wall St analyst Richard Bowman and Simply Wall St have no position in any of the companies mentioned. This article is general in nature. We provide commentary based on historical data and analyst forecasts only using an unbiased methodology and our articles are not intended to be financial advice. It does not constitute a recommendation to buy or sell any stock and does not take account of your objectives, or your financial situation. We aim to bring you long-term focused analysis driven by fundamental data. Note that our analysis may not factor in the latest price-sensitive company announcements or qualitative material.
Richard Bowman
Richard is an analyst, writer and investor based in Cape Town, South Africa. He has written for several online investment publications and continues to do so. Richard is fascinated by economics, financial markets and behavioral finance. He is also passionate about tools and content that make investing accessible to everyone.