
What Happened in the Market This Week?
Equity markets continued higher this week, marking this as the 5th consecutive week that investors have seen green. The buying has become broad-based with all sectors gaining, however consumer discretionary, materials and financials outperformed on the week.
Q2 Earnings Season in the U.S. continues into Week 5, after notable companies like Walmart (NYSE:WMT), BHP (ASX:BHP) and Cisco Systems (Nasdaq:CSCO) reported this week. As always, you may view our Earnings Calendar for this week at the bottom of this email, and our previous calendars in previous Market Insights.
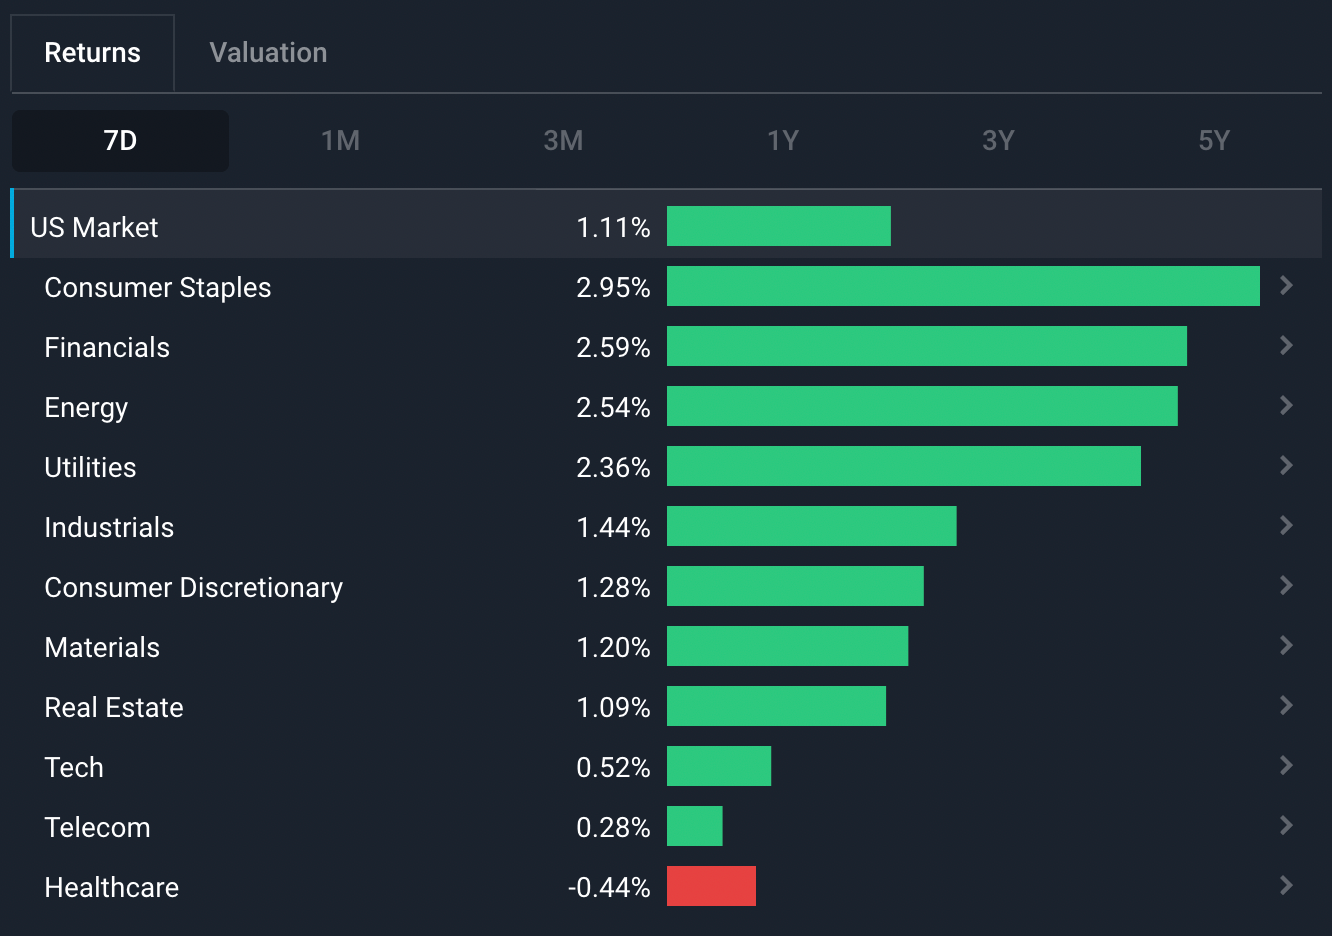
U.S. Sector 7D Performance - 19th Aug 2022 - Simply Wall St
Some of the developments we have been watching over the last week include:
-
China’s Economic Crisis is continuing as its central bank finally intervenes, resulting in a surprise rate cut last week.
-
The S&P 500 has regained half of its YTD losses after an 18% rally, leading to questions on whether the market is simply experiencing a bear market rally or if this is finally a reversal of the downwards trend.
China’s Economy Continues to Weaken
While most countries tighten, China has loosened. China’s central bank unexpectedly cut interest rates by 10 basis points (0.1%) last week, after several data releases pointed to more weakness in the economy.
After decades of strong growth, the country’s economy is succumbing to policy decisions which the Chinese Communist Party (CCP) insists on sticking with. In the last few years, policies in the country included the country’s zero-COVID policy, policies to reduce leverage in the property sector, and China’s regulatory crackdown on technology and education companies.
China's 2022 Economic Crisis
A raft of recent economic data releases are indicating that China is experiencing a very real slowdown. We previously covered the Real Estate Crisis in China in our previous Market Insight, which along with severe Covid lockdowns is at the heart of the current Economic crisis. China's crisis has also caused supply chain issues globally, which is one of the factors in the rising inflation experienced by almost every major country.
Some of the latest numbers include:
-
Retail sales which were expected to increase by 4.9% grew instead by 2.7%.
-
Property sales fell 29% in the year to July, after falling 18% in the year to June.
-
Construction starts fell 45% year-on-year.
-
Industrial output rose only 3.8% compared to forecasts of 4.3%.
-
Youth unemployment (15-24 years old) increased to a record high of 19.9%.
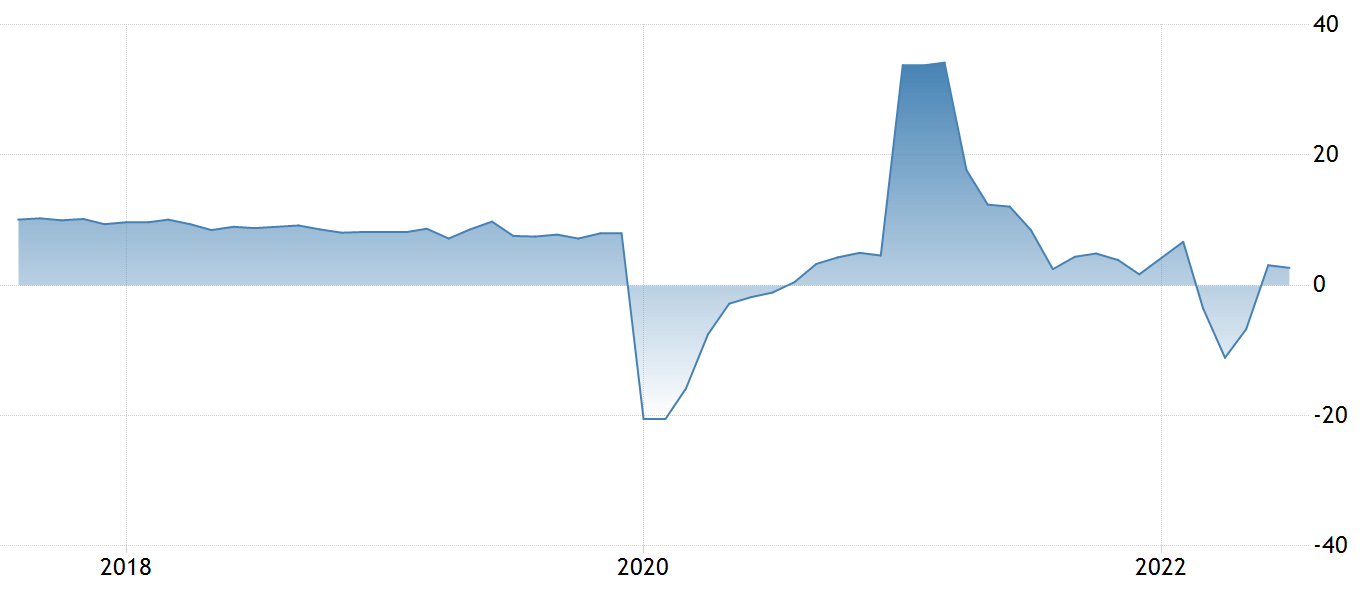
China 2017-2022 Year-on-Year Retail Sales - Image Credit: tradingeconomics.com
The Outlook for China's Economy
It isn’t surprising to see that economists are now cutting their GDP growth forecasts for the country. China’s inflation rate is about 4.2%, which is substantially lower than the U.S. and Europe. However that could change if lockdowns are relaxed and consumer spending rebounds.
Beyond the immediate economic indicators, there are also signs that investors, companies and skilled workers are losing confidence in China. Multinational companies such as Apple (Nasdaq:AAPL) have begun moving operations to Southeast Asia, and fresh college and expatriates relocate to other countries. This could have longer term implications if the trend continues.
What types of companies have exposure to China?
Companies that are both based in China and operate within the country are naturally the most exposed, however there are lots of other companies around the world with exposure to the Chinese economy.
U.S. Companies like Apple (Nasdaq: AAPL), Nike (NYSE:NKE), Tesla (Nasdaq:TSLA) and Starbucks (Nasdaq:SBUX) all have exposure to consumer spending in China. Countries from the European region, such as LVMH Moët Hennessy (ENXTPA:MC), Siemens (XTRA:SIE) and Volkswagen (XTRA:VOW3), also have growing business operations in China. While China doesn’t account for all the revenue of these companies, the country’s economic state is a factor investors should consider.
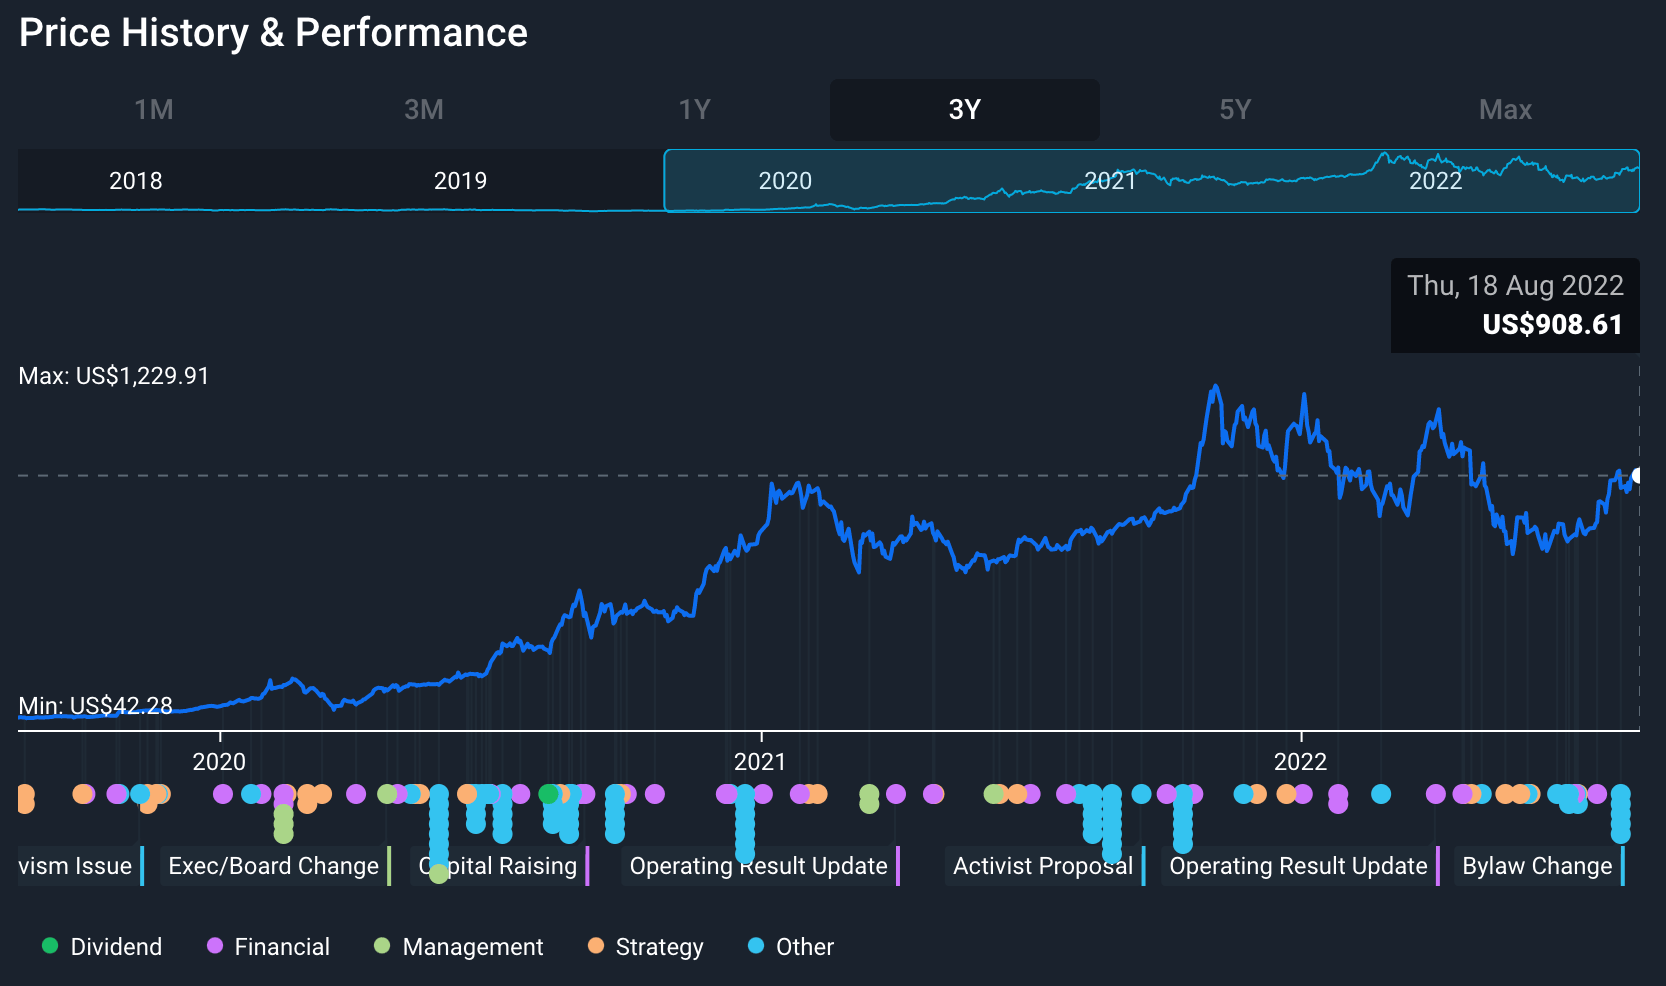
Tesla (Nasdaq:TSLA) Stock Price Chart on Simply Wall St
Aside from the retailers above, there are also companies that supply components to the manufacturing industry in China. The largest of these are semiconductor companies such as Texas Instruments (Nasdaq:TXN) and Qualcomm (Nasdaq:QCOM), some of which derive more than 50% of their revenue in the country.
China is also the largest buyer of industrial commodities in the world, which is of importance to companies like BHP (ASX:BHP) and Rio Tinto (LSE:RIO). Not only do these companies sell their products to China, but demand from China affects the price of resources like oil, copper and iron ore around the world. Lower demand from China means lower volumes and lower market prices, which can impact other producers accordingly.
The Insight: At its current economic environment, investment exposure to China may be on the riskier side. It’s not just a question of the economy, trade relationships, regulatory action and government policies also play a role. However, it is also worth keeping an eye out for signs of a change in China’s stance on the policies that have led to this point.
The Chinese Communist Party will be holding its 20th national congress later this year. This may result in a doubling down on policies - or on a new approach. Either way, it could be a catalyst for the Chinese market, so it’s something worth keeping an eye on if you’re interested in investing in that market.
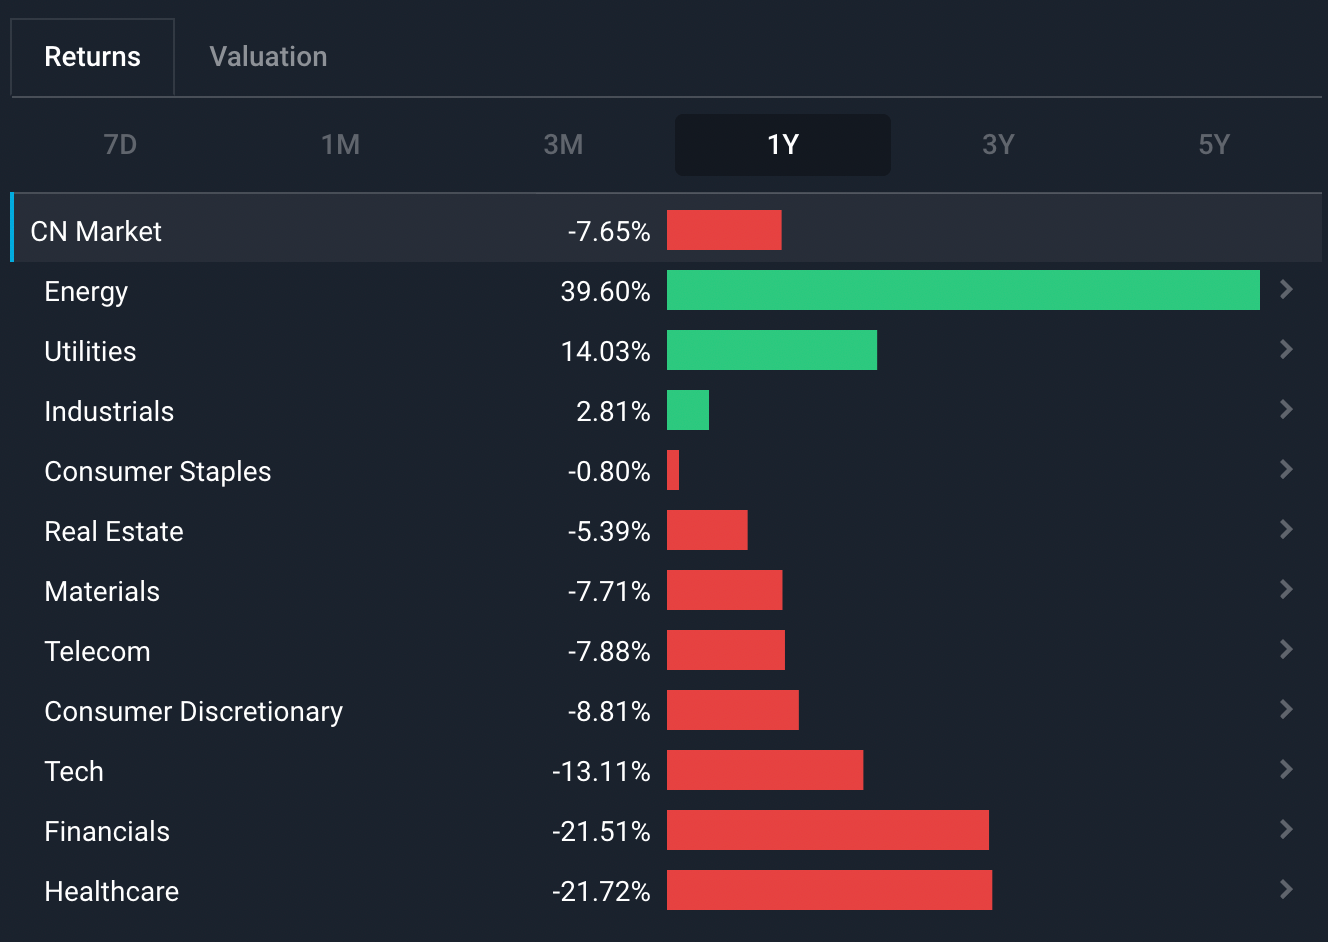
China (SSE) 1Y Sector Trends Performance on Simply Wall St
The S&P 500 Has Rallied 18% in the Last Two Months
The S&P 500 index has rallied nearly 19% since mid-June, and has regained about 55% of its year-to-date losses. The index is now just below its 200-day moving average - an important technical indicator - and down around 10% for the year. The performance of individual sectors paints a very different picture with Energy stocks up 38% YTD, while the Telecoms sector is down 22%.
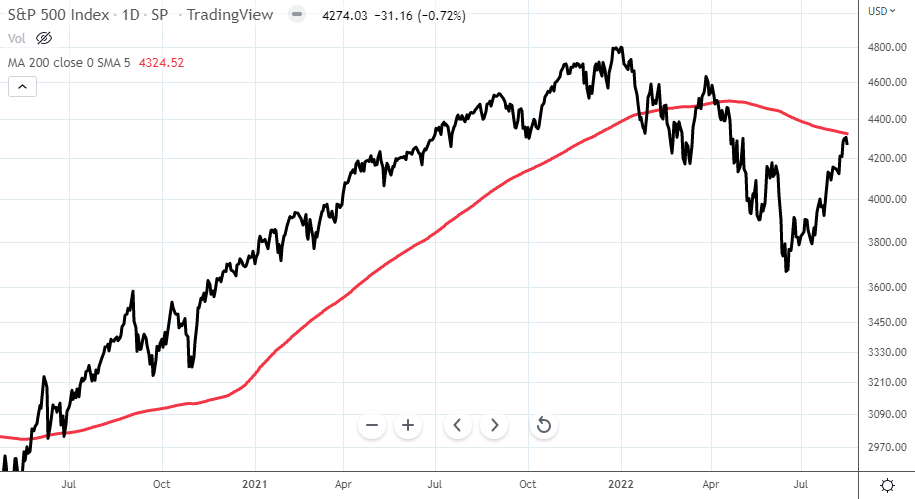
S&P 500 index and 200-day moving average - Image Credit: tradingview.com
Is this a bear market rally or the start of a new trend?
Some of the biggest and fastest rallies occur during bear markets. During the bear market from 2000-2003 after the burst of the dotcom bubble, there were four rallies of returns between 19% and 22%. During the GFC between 2008-2009, there were two rallies of between 18% and 24%. History thus shows that bear market rallies such as this can occur before the index then reverses to reach a new low.
History does often repeat itself, but that doesn’t mean it will every time. Analysts in Wall Street look to be leaning more towards this being a bear market rally rather than a new bull run. Calling market tops and bottoms and finding the perfect time to buy or sell is always a guessing game, and certainly not something to bet your portfolio on.
The Insight: Investing during Market Volatility
A well-balanced portfolio that is constructed to benefit from or survive a range of outcomes, rather than constructed based on a single prediction, tends to produce better long-term results. Seasoned investors have learned to think in probabilities, rather than absolutes. If you have exposure to several different sectors as an investor, you reduce your portfolio’s volatility and risk. You can then make adjustments to your portfolio if your investment thesis on any stock changes as a result of macroeconomic developments.
Sectors like Utilities, Consumer Staples and Healthcare typically outperform during bear markets as their revenues aren’t as sensitive to the business cycle. Mature Technology companies can also be relatively defensive as long as they continue to invest for the long term. Energy (and to an extent, Materials) stocks can act as a hedge if inflation persists or commodity prices rebound.
Additionally, many of the industries in the Industrial sector, as well as Consumer Discretionary stocks, are exposed to the strength of the economy. Companies in these sectors may remain under pressure if the economy weakens further, but if economic conditions improve, they typically perform well.
We had previously written on both how to invest during a period of rate hikes and how to invest during a recession - both of which bring lessons that you can apply to investing during market volatility. Alternatively, our Simply Wall St Market Insights Hub collates all our previous Market Insight articles that offer valuable explanations on investing during the current economic environment.

Key Events This Week
This week, the U.S. will be releasing most of the key data. Data on new home sales will be released on Tuesday, which will provide an indication on the real estate market, after previous data pointed towards a slowdown.
Wednesday will see data on durable good orders, a measure of current industrial activity, and an updated estimate on U.S. Q2 GDP on Thursday. GDP Estimates are often revised as the U.S. Bureau of Economic Analysis (BEA) acquires more information on the economy and can therefore provide a better estimate. The last estimate had it at -0.9%, which meant that the U.S. is now in a technical recession.
On Friday, personal income, spending and sentiment data will be released, which will provide insight on individual consumer sentiment.
In Australia, the 2022 FY Annual Profit Season is reaching its peak next week with the bulk of its listed companies reporting, including Wesfarmers (ASX:WES), South32 (ASX:S32), and Woolworths Group (ASX:WOW). The U.S. Q2 Earnings Season is also reaching its final leg, with the earnings calendar below.
🗓 Earnings Season Calendar (Aug 22 - Aug 26, 2022)
Mon 22 Aug
Zoom Video (ZM) Communications
Tue 23 Aug
Intuit (INTU) • Medtronic (MDT) • JD.com (JD) • XPeng Inc. (XPEV)
Wed 24 Aug
NVIDIA (NVDA) • Salesforce (CRM) • Royal Bank of Canada (TSX:RY) • Snowflake (SNOW) • National Bank of Canada (TSX:NA)
Thu 25 Aug
Dell Technologies (DELL) • AIA Group (SEHK:1299) • VMWare (VMW) • Grab (GRAB)
Fri 26 Aug
China Shenhua Energy (SEHK:1088)
Was this article helpful? Register for free with Simply Wall St to receive our weekly market insights straight to your inbox!
Until next week,
Invest Well,
Simply Wall St
Have feedback on this article? Concerned about the content? Get in touch with us directly. Alternatively, email editorial-team@simplywallst.com
Simply Wall St analyst Richard Bowman and Simply Wall St have no position in any of the companies mentioned. This article is general in nature. Any comments below from SWS employees are their opinions only, should not be taken as financial advice and may not represent the views of Simply Wall St. Unless otherwise advised, SWS employees providing commentary do not own a position in any company mentioned in the article or in their comments.We provide analysis based on historical data and analyst forecasts only using an unbiased methodology and our articles are not intended to be financial advice. It does not constitute a recommendation to buy or sell any stock and does not take account of your objectives, or your financial situation. We aim to bring you long-term focused analysis driven by fundamental data. Note that our analysis may not factor in the latest price-sensitive company announcements or qualitative material.
Richard Bowman
Richard is an analyst, writer and investor based in Cape Town, South Africa. He has written for several online investment publications and continues to do so. Richard is fascinated by economics, financial markets and behavioral finance. He is also passionate about tools and content that make investing accessible to everyone.

