Stock Analysis
- South Africa
- /
- IT
- /
- JSE:PBG
Is PBT Group Limited's (JSE:PBG) Stock's Recent Performance Being Led By Its Attractive Financial Prospects?


PBT Group's (JSE:PBG) stock is up by a considerable 10% over the past week. Since the market usually pay for a company’s long-term fundamentals, we decided to study the company’s key performance indicators to see if they could be influencing the market. In this article, we decided to focus on PBT Group's ROE.
Return on equity or ROE is a key measure used to assess how efficiently a company's management is utilizing the company's capital. Simply put, it is used to assess the profitability of a company in relation to its equity capital.
Check out our latest analysis for PBT Group
How Is ROE Calculated?
The formula for ROE is:
Return on Equity = Net Profit (from continuing operations) ÷ Shareholders' Equity
So, based on the above formula, the ROE for PBT Group is:
23% = R98m ÷ R422m (Based on the trailing twelve months to March 2023).
The 'return' is the yearly profit. One way to conceptualize this is that for each ZAR1 of shareholders' capital it has, the company made ZAR0.23 in profit.
Why Is ROE Important For Earnings Growth?
We have already established that ROE serves as an efficient profit-generating gauge for a company's future earnings. Depending on how much of these profits the company reinvests or "retains", and how effectively it does so, we are then able to assess a company’s earnings growth potential. Generally speaking, other things being equal, firms with a high return on equity and profit retention, have a higher growth rate than firms that don’t share these attributes.
PBT Group's Earnings Growth And 23% ROE
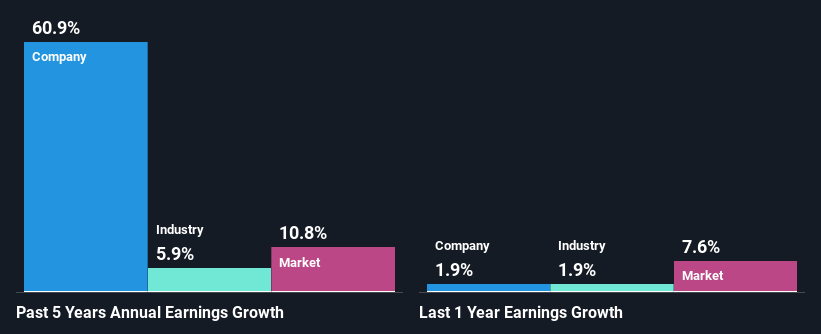
To begin with, PBT Group seems to have a respectable ROE. And on comparing with the industry, we found that the the average industry ROE is similar at 22%. Consequently, this likely laid the ground for the impressive net income growth of 61% seen over the past five years by PBT Group. However, there could also be other drivers behind this growth. Such as - high earnings retention or an efficient management in place.
Next, on comparing with the industry net income growth, we found that PBT Group's growth is quite high when compared to the industry average growth of 5.9% in the same period, which is great to see.
The basis for attaching value to a company is, to a great extent, tied to its earnings growth. It’s important for an investor to know whether the market has priced in the company's expected earnings growth (or decline). This then helps them determine if the stock is placed for a bright or bleak future. If you're wondering about PBT Group's's valuation, check out this gauge of its price-to-earnings ratio, as compared to its industry.
Is PBT Group Making Efficient Use Of Its Profits?
PBT Group has a significant three-year median payout ratio of 59%, meaning the company only retains 41% of its income. This implies that the company has been able to achieve high earnings growth despite returning most of its profits to shareholders.
Moreover, PBT Group is determined to keep sharing its profits with shareholders which we infer from its long history of paying a dividend for at least ten years.
Summary
On the whole, we feel that PBT Group's performance has been quite good. In particular, its high ROE is quite noteworthy and also the probable explanation behind its considerable earnings growth. Yet, the company is retaining a small portion of its profits. Which means that the company has been able to grow its earnings in spite of it, so that's not too bad. Until now, we have only just grazed the surface of the company's past performance by looking at the company's fundamentals. You can do your own research on PBT Group and see how it has performed in the past by looking at this FREE detailed graph of past earnings, revenue and cash flows.
New: Manage All Your Stock Portfolios in One Place
We've created the ultimate portfolio companion for stock investors, and it's free.
• Connect an unlimited number of Portfolios and see your total in one currency
• Be alerted to new Warning Signs or Risks via email or mobile
• Track the Fair Value of your stocks
Have feedback on this article? Concerned about the content? Get in touch with us directly. Alternatively, email editorial-team (at) simplywallst.com.
This article by Simply Wall St is general in nature. We provide commentary based on historical data and analyst forecasts only using an unbiased methodology and our articles are not intended to be financial advice. It does not constitute a recommendation to buy or sell any stock, and does not take account of your objectives, or your financial situation. We aim to bring you long-term focused analysis driven by fundamental data. Note that our analysis may not factor in the latest price-sensitive company announcements or qualitative material. Simply Wall St has no position in any stocks mentioned.
About JSE:PBG
PBT Group
Provides specialized consulting services to finance, insurance, medical healthcare, retail, telecommunication, and other sectors in South Africa, Europe, and the United Kingdom.
Flawless balance sheet established dividend payer.
