Stock Analysis
- South Africa
- /
- Capital Markets
- /
- JSE:YYLBEE
Strong week for YeboYethu (RF) (JSE:YYLBEE) shareholders doesn't alleviate pain of three-year loss


This week we saw the YeboYethu (RF) Limited (JSE:YYLBEE) share price climb by 16%. But that doesn't help the fact that the three year return is less impressive. Truth be told the share price declined 48% in three years and that return, Dear Reader, falls short of what you could have got from passive investing with an index fund.
On a more encouraging note the company has added R172m to its market cap in just the last 7 days, so let's see if we can determine what's driven the three-year loss for shareholders.
View our latest analysis for YeboYethu (RF)
Because YeboYethu (RF) made a loss in the last twelve months, we think the market is probably more focussed on revenue and revenue growth, at least for now. Generally speaking, companies without profits are expected to grow revenue every year, and at a good clip. Some companies are willing to postpone profitability to grow revenue faster, but in that case one would hope for good top-line growth to make up for the lack of earnings.
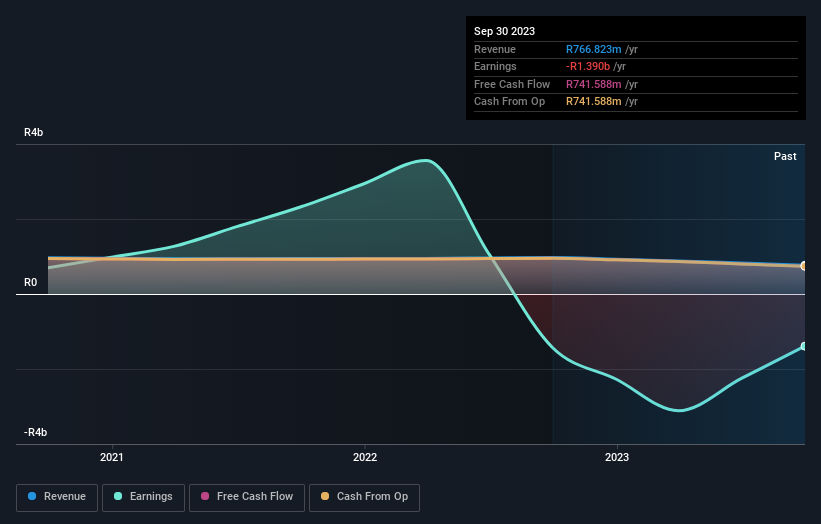
In the last three years YeboYethu (RF) saw its revenue shrink by 4.9% per year. That's not what investors generally want to see. The annual decline of 14% per year in that period has clearly disappointed holders. That makes sense given the lack of either profits or revenue growth. Of course, sentiment could become too negative, and the company may actually be making progress to profitability.
The graphic below depicts how earnings and revenue have changed over time (unveil the exact values by clicking on the image).
This free interactive report on YeboYethu (RF)'s balance sheet strength is a great place to start, if you want to investigate the stock further.
What About Dividends?
It is important to consider the total shareholder return, as well as the share price return, for any given stock. Whereas the share price return only reflects the change in the share price, the TSR includes the value of dividends (assuming they were reinvested) and the benefit of any discounted capital raising or spin-off. It's fair to say that the TSR gives a more complete picture for stocks that pay a dividend. In the case of YeboYethu (RF), it has a TSR of -40% for the last 3 years. That exceeds its share price return that we previously mentioned. This is largely a result of its dividend payments!
A Different Perspective
YeboYethu (RF) shareholders are down 28% for the year (even including dividends), but the market itself is up 6.7%. Even the share prices of good stocks drop sometimes, but we want to see improvements in the fundamental metrics of a business, before getting too interested. On the bright side, long term shareholders have made money, with a gain of 11% per year over half a decade. It could be that the recent sell-off is an opportunity, so it may be worth checking the fundamental data for signs of a long term growth trend. While it is well worth considering the different impacts that market conditions can have on the share price, there are other factors that are even more important. Like risks, for instance. Every company has them, and we've spotted 4 warning signs for YeboYethu (RF) (of which 2 are a bit concerning!) you should know about.
Of course YeboYethu (RF) may not be the best stock to buy. So you may wish to see this free collection of growth stocks.
Please note, the market returns quoted in this article reflect the market weighted average returns of stocks that currently trade on South African exchanges.
New: Manage All Your Stock Portfolios in One Place
We've created the ultimate portfolio companion for stock investors, and it's free.
• Connect an unlimited number of Portfolios and see your total in one currency
• Be alerted to new Warning Signs or Risks via email or mobile
• Track the Fair Value of your stocks
Have feedback on this article? Concerned about the content? Get in touch with us directly. Alternatively, email editorial-team (at) simplywallst.com.
This article by Simply Wall St is general in nature. We provide commentary based on historical data and analyst forecasts only using an unbiased methodology and our articles are not intended to be financial advice. It does not constitute a recommendation to buy or sell any stock, and does not take account of your objectives, or your financial situation. We aim to bring you long-term focused analysis driven by fundamental data. Note that our analysis may not factor in the latest price-sensitive company announcements or qualitative material. Simply Wall St has no position in any stocks mentioned.
About JSE:YYLBEE
YeboYethu (RF)
Engages in the business of acquiring and holding shares in Vodacom Group.
Moderate and good value.
