
Advertisement
When researching a stock for investment, what can tell us that the company is in decline? A business that's potentially in decline often shows two trends, a return on capital employed (ROCE) that's declining, and a base of capital employed that's also declining. Trends like this ultimately mean the business is reducing its investments and also earning less on what it has invested. And from a first read, things don't look too good at Trellidor Holdings (JSE:TRL), so let's see why.
What Is Return On Capital Employed (ROCE)?
If you haven't worked with ROCE before, it measures the 'return' (pre-tax profit) a company generates from capital employed in its business. The formula for this calculation on Trellidor Holdings is:
Return on Capital Employed = Earnings Before Interest and Tax (EBIT) ÷ (Total Assets - Current Liabilities)
0.11 = R22m ÷ (R431m - R226m) (Based on the trailing twelve months to June 2023).
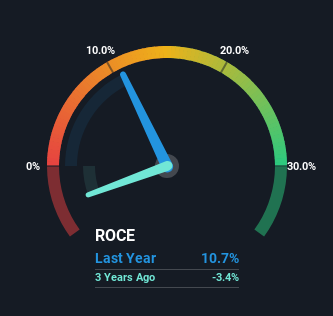
Thus, Trellidor Holdings has an ROCE of 11%. In isolation, that's a pretty standard return but against the Building industry average of 20%, it's not as good.
View our latest analysis for Trellidor Holdings
While the past is not representative of the future, it can be helpful to know how a company has performed historically, which is why we have this chart above. If you're interested in investigating Trellidor Holdings' past further, check out this free graph of past earnings, revenue and cash flow.
What Can We Tell From Trellidor Holdings' ROCE Trend?
In terms of Trellidor Holdings' historical ROCE trend, it isn't fantastic. The company used to generate 31% on its capital five years ago but it has since fallen noticeably. What's equally concerning is that the amount of capital deployed in the business has shrunk by 30% over that same period. The fact that both are shrinking is an indication that the business is going through some tough times. Typically businesses that exhibit these characteristics aren't the ones that tend to multiply over the long term, because statistically speaking, they've already gone through the growth phase of their life cycle.
On a side note, Trellidor Holdings' current liabilities have increased over the last five years to 52% of total assets, effectively distorting the ROCE to some degree. Without this increase, it's likely that ROCE would be even lower than 11%. What this means is that in reality, a rather large portion of the business is being funded by the likes of the company's suppliers or short-term creditors, which can bring some risks of its own.
What We Can Learn From Trellidor Holdings' ROCE
In summary, it's unfortunate that Trellidor Holdings is shrinking its capital base and also generating lower returns. Investors haven't taken kindly to these developments, since the stock has declined 47% from where it was five years ago. That being the case, unless the underlying trends revert to a more positive trajectory, we'd consider looking elsewhere.
If you'd like to know about the risks facing Trellidor Holdings, we've discovered 4 warning signs that you should be aware of.
For those who like to invest in solid companies, check out this free list of companies with solid balance sheets and high returns on equity.
Valuation is complex, but we're here to simplify it.
Discover if Trellidor Holdings might be undervalued or overvalued with our detailed analysis, featuring fair value estimates, potential risks, dividends, insider trades, and its financial condition.
Access Free AnalysisHave feedback on this article? Concerned about the content? Get in touch with us directly. Alternatively, email editorial-team (at) simplywallst.com.
This article by Simply Wall St is general in nature. We provide commentary based on historical data and analyst forecasts only using an unbiased methodology and our articles are not intended to be financial advice. It does not constitute a recommendation to buy or sell any stock, and does not take account of your objectives, or your financial situation. We aim to bring you long-term focused analysis driven by fundamental data. Note that our analysis may not factor in the latest price-sensitive company announcements or qualitative material. Simply Wall St has no position in any stocks mentioned.
About JSE:TRL
Trellidor Holdings
An investment holding company, engages in the manufacture, sale, and installation of custom-made security barrier products in South Africa, the United Kingdom, and Ghana.
Flawless balance sheet and good value.
Market Insights

Advertisement
Community Narratives
The "Molecular Pencil": Why Beam's Technology is Built to Win
Fair Value US$65.01|65.4% undervalued
DA
Community Contributor
The silent giant behind virtually every advanced chip powering AI, smartphones, and modern infrastructure.
Fair Value US$310.00|6.1% undervalued
OS
Community Contributor
ADP Stock: Solid Fundamentals, But AI Investments Test Its Margin Resilience
Fair Value US$387.77|34.2% undervalued
YI
Community Contributor
MINISO's fair value is projected at 26.69 with an anticipated PE ratio shift of 20x
Fair Value US$24.03|9.6% undervalued
BE
Community Contributor