
Advertisement
- South Africa
- /
- Building
- /
- JSE:TRL
These Return Metrics Don't Make Trellidor Holdings (JSE:TRL) Look Too Strong
Ignoring the stock price of a company, what are the underlying trends that tell us a business is past the growth phase? When we see a declining return on capital employed (ROCE) in conjunction with a declining base of capital employed, that's often how a mature business shows signs of aging. Trends like this ultimately mean the business is reducing its investments and also earning less on what it has invested. So after glancing at the trends within Trellidor Holdings (JSE:TRL), we weren't too hopeful.
What Is Return On Capital Employed (ROCE)?
For those who don't know, ROCE is a measure of a company's yearly pre-tax profit (its return), relative to the capital employed in the business. Analysts use this formula to calculate it for Trellidor Holdings:
Return on Capital Employed = Earnings Before Interest and Tax (EBIT) ÷ (Total Assets - Current Liabilities)
0.07 = R22m ÷ (R431m - R115m) (Based on the trailing twelve months to December 2023).
Therefore, Trellidor Holdings has an ROCE of 7.0%. In absolute terms, that's a low return and it also under-performs the Building industry average of 17%.
See our latest analysis for Trellidor Holdings
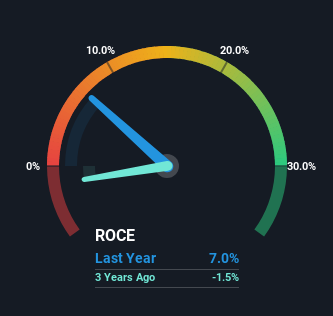
Historical performance is a great place to start when researching a stock so above you can see the gauge for Trellidor Holdings' ROCE against it's prior returns. If you're interested in investigating Trellidor Holdings' past further, check out this free graph covering Trellidor Holdings' past earnings, revenue and cash flow.
What The Trend Of ROCE Can Tell Us
We are a bit worried about the trend of returns on capital at Trellidor Holdings. Unfortunately the returns on capital have diminished from the 28% that they were earning five years ago. On top of that, it's worth noting that the amount of capital employed within the business has remained relatively steady. Since returns are falling and the business has the same amount of assets employed, this can suggest it's a mature business that hasn't had much growth in the last five years. If these trends continue, we wouldn't expect Trellidor Holdings to turn into a multi-bagger.
The Key Takeaway
All in all, the lower returns from the same amount of capital employed aren't exactly signs of a compounding machine. Investors haven't taken kindly to these developments, since the stock has declined 52% from where it was five years ago. With underlying trends that aren't great in these areas, we'd consider looking elsewhere.
Trellidor Holdings does have some risks though, and we've spotted 4 warning signs for Trellidor Holdings that you might be interested in.
While Trellidor Holdings may not currently earn the highest returns, we've compiled a list of companies that currently earn more than 25% return on equity. Check out this free list here.
Valuation is complex, but we're here to simplify it.
Discover if Trellidor Holdings might be undervalued or overvalued with our detailed analysis, featuring fair value estimates, potential risks, dividends, insider trades, and its financial condition.
Access Free AnalysisHave feedback on this article? Concerned about the content? Get in touch with us directly. Alternatively, email editorial-team (at) simplywallst.com.
This article by Simply Wall St is general in nature. We provide commentary based on historical data and analyst forecasts only using an unbiased methodology and our articles are not intended to be financial advice. It does not constitute a recommendation to buy or sell any stock, and does not take account of your objectives, or your financial situation. We aim to bring you long-term focused analysis driven by fundamental data. Note that our analysis may not factor in the latest price-sensitive company announcements or qualitative material. Simply Wall St has no position in any stocks mentioned.
About JSE:TRL
Trellidor Holdings
An investment holding company, engages in the manufacture, sale, and installation of custom-made security barrier products in South Africa, the United Kingdom, and Ghana.
Flawless balance sheet and good value.
Market Insights

Advertisement
Community Narratives
MicroVision will explode future revenue by 380.37% with a vision towards success
Fair Value US$60.00|98.5% undervalued
TH
Community Contributor
The Indispensable Artery for a New North American Economy
Fair Value CA$132.87|2.3% undervalued
TI
Community Contributor