- South Africa
- /
- Building
- /
- JSE:TRL
Revenues Tell The Story For Trellidor Holdings Limited (JSE:TRL) As Its Stock Soars 32%
The Trellidor Holdings Limited (JSE:TRL) share price has done very well over the last month, posting an excellent gain of 32%. Not all shareholders will be feeling jubilant, since the share price is still down a very disappointing 13% in the last twelve months.
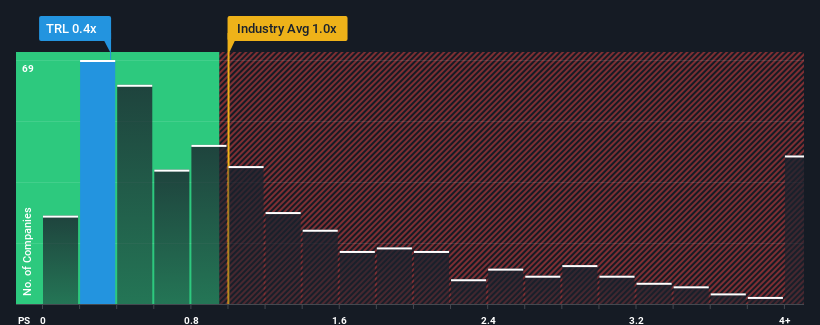
Although its price has surged higher, it's still not a stretch to say that Trellidor Holdings' price-to-sales (or "P/S") ratio of 0.4x right now seems quite "middle-of-the-road" compared to the Building industry in South Africa, seeing as it matches the P/S ratio of the wider industry. Although, it's not wise to simply ignore the P/S without explanation as investors may be disregarding a distinct opportunity or a costly mistake.
Check out our latest analysis for Trellidor Holdings

What Does Trellidor Holdings' Recent Performance Look Like?
The recent revenue growth at Trellidor Holdings would have to be considered satisfactory if not spectacular. One possibility is that the P/S is moderate because investors think this good revenue growth might only be parallel to the broader industry in the near future. If you like the company, you'd be hoping this isn't the case so that you could potentially pick up some stock while it's not quite in favour.
Although there are no analyst estimates available for Trellidor Holdings, take a look at this free data-rich visualisation to see how the company stacks up on earnings, revenue and cash flow.How Is Trellidor Holdings' Revenue Growth Trending?
In order to justify its P/S ratio, Trellidor Holdings would need to produce growth that's similar to the industry.
If we review the last year of revenue growth, the company posted a worthy increase of 3.6%. Revenue has also lifted 22% in aggregate from three years ago, partly thanks to the last 12 months of growth. Therefore, it's fair to say the revenue growth recently has been respectable for the company.
It's interesting to note that the rest of the industry is similarly expected to grow by 6.7% over the next year, which is fairly even with the company's recent medium-term annualised growth rates.
In light of this, it's understandable that Trellidor Holdings' P/S sits in line with the majority of other companies. It seems most investors are expecting to see average growth rates continue into the future and are only willing to pay a moderate amount for the stock.
The Final Word
Trellidor Holdings appears to be back in favour with a solid price jump bringing its P/S back in line with other companies in the industry Using the price-to-sales ratio alone to determine if you should sell your stock isn't sensible, however it can be a practical guide to the company's future prospects.
As we've seen, Trellidor Holdings' three-year revenue trends seem to be contributing to its P/S, given they look similar to current industry expectations. Currently, with a past revenue trend that aligns closely wit the industry outlook, shareholders are confident the company's future revenue outlook won't contain any major surprises. Given the current circumstances, it seems improbable that the share price will experience any significant movement in either direction in the near future if recent medium-term revenue trends persist.
Having said that, be aware Trellidor Holdings is showing 4 warning signs in our investment analysis, and 3 of those make us uncomfortable.
Of course, profitable companies with a history of great earnings growth are generally safer bets. So you may wish to see this free collection of other companies that have reasonable P/E ratios and have grown earnings strongly.
Valuation is complex, but we're here to simplify it.
Discover if Trellidor Holdings might be undervalued or overvalued with our detailed analysis, featuring fair value estimates, potential risks, dividends, insider trades, and its financial condition.
Access Free AnalysisHave feedback on this article? Concerned about the content? Get in touch with us directly. Alternatively, email editorial-team (at) simplywallst.com.
This article by Simply Wall St is general in nature. We provide commentary based on historical data and analyst forecasts only using an unbiased methodology and our articles are not intended to be financial advice. It does not constitute a recommendation to buy or sell any stock, and does not take account of your objectives, or your financial situation. We aim to bring you long-term focused analysis driven by fundamental data. Note that our analysis may not factor in the latest price-sensitive company announcements or qualitative material. Simply Wall St has no position in any stocks mentioned.
Have feedback on this article? Concerned about the content? Get in touch with us directly. Alternatively, email editorial-team@simplywallst.com
About JSE:TRL
Trellidor Holdings
An investment holding company, engages in the manufacture, sale, and installation of custom-made security barrier products in South Africa, the United Kingdom, and Ghana.
Flawless balance sheet and good value.
Market Insights
Community Narratives


Recently Updated Narratives


The Quiet Giant That Became AI’s Power Grid


Nova Ljubljanska Banka d.d will expect a 11.2% revenue boost driving future growth


