Stock Analysis
- United States
- /
- Electric Utilities
- /
- NYSE:SO
Southern (NYSE:SO) shareholders have earned a 10% CAGR over the last five years

If you buy and hold a stock for many years, you'd hope to be making a profit. Furthermore, you'd generally like to see the share price rise faster than the market. But The Southern Company (NYSE:SO) has fallen short of that second goal, with a share price rise of 33% over five years, which is below the market return. Over the last twelve months the stock price has risen a very respectable 6.6%.
Now it's worth having a look at the company's fundamentals too, because that will help us determine if the long term shareholder return has matched the performance of the underlying business.
Check out our latest analysis for Southern
While the efficient markets hypothesis continues to be taught by some, it has been proven that markets are over-reactive dynamic systems, and investors are not always rational. One imperfect but simple way to consider how the market perception of a company has shifted is to compare the change in the earnings per share (EPS) with the share price movement.
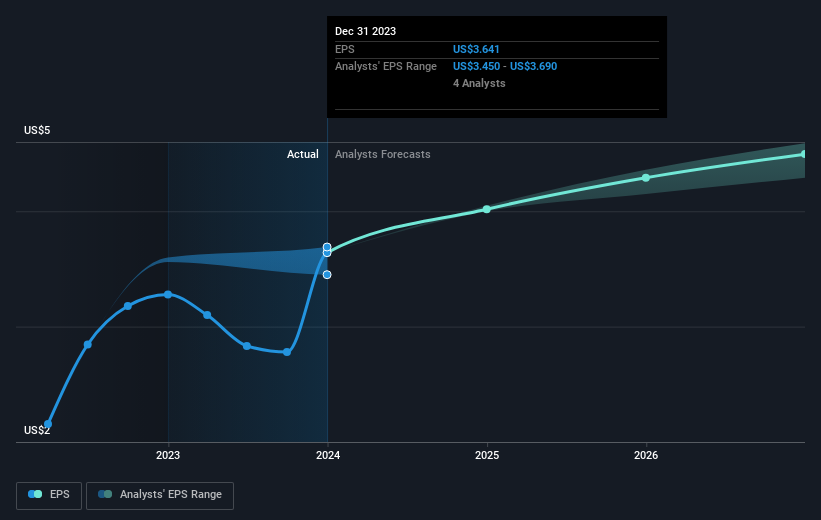
Over half a decade, Southern managed to grow its earnings per share at 11% a year. This EPS growth is higher than the 6% average annual increase in the share price. So it seems the market isn't so enthusiastic about the stock these days.
The graphic below depicts how EPS has changed over time (unveil the exact values by clicking on the image).
It's probably worth noting that the CEO is paid less than the median at similar sized companies. But while CEO remuneration is always worth checking, the really important question is whether the company can grow earnings going forward. Before buying or selling a stock, we always recommend a close examination of historic growth trends, available here..
What About Dividends?
As well as measuring the share price return, investors should also consider the total shareholder return (TSR). The TSR is a return calculation that accounts for the value of cash dividends (assuming that any dividend received was reinvested) and the calculated value of any discounted capital raisings and spin-offs. Arguably, the TSR gives a more comprehensive picture of the return generated by a stock. As it happens, Southern's TSR for the last 5 years was 63%, which exceeds the share price return mentioned earlier. The dividends paid by the company have thusly boosted the total shareholder return.
A Different Perspective
Southern provided a TSR of 11% over the last twelve months. But that was short of the market average. The silver lining is that the gain was actually better than the average annual return of 10% per year over five year. This suggests the company might be improving over time. It's always interesting to track share price performance over the longer term. But to understand Southern better, we need to consider many other factors. Even so, be aware that Southern is showing 3 warning signs in our investment analysis , and 1 of those is a bit concerning...
Of course, you might find a fantastic investment by looking elsewhere. So take a peek at this free list of companies we expect will grow earnings.
Please note, the market returns quoted in this article reflect the market weighted average returns of stocks that currently trade on American exchanges.
Valuation is complex, but we're helping make it simple.
Find out whether Southern is potentially over or undervalued by checking out our comprehensive analysis, which includes fair value estimates, risks and warnings, dividends, insider transactions and financial health.
View the Free AnalysisHave feedback on this article? Concerned about the content? Get in touch with us directly. Alternatively, email editorial-team (at) simplywallst.com.
This article by Simply Wall St is general in nature. We provide commentary based on historical data and analyst forecasts only using an unbiased methodology and our articles are not intended to be financial advice. It does not constitute a recommendation to buy or sell any stock, and does not take account of your objectives, or your financial situation. We aim to bring you long-term focused analysis driven by fundamental data. Note that our analysis may not factor in the latest price-sensitive company announcements or qualitative material. Simply Wall St has no position in any stocks mentioned.
About NYSE:SO
Southern
The Southern Company, through its subsidiaries, engages in the generation, transmission, and distribution of electricity.
Proven track record average dividend payer.

