- United States
- /
- Other Utilities
- /
- NYSE:PEG
Public Service Enterprise Group's (NYSE:PEG) investors will be pleased with their notable 67% return over the last year


The simplest way to invest in stocks is to buy exchange traded funds. But one can do better than that by picking better than average stocks (as part of a diversified portfolio). For example, the Public Service Enterprise Group Incorporated (NYSE:PEG) share price is up 61% in the last 1 year, clearly besting the market return of around 32% (not including dividends). If it can keep that out-performance up over the long term, investors will do very well! It is also impressive that the stock is up 44% over three years, adding to the sense that it is a real winner.
Let's take a look at the underlying fundamentals over the longer term, and see if they've been consistent with shareholders returns.
View our latest analysis for Public Service Enterprise Group
To paraphrase Benjamin Graham: Over the short term the market is a voting machine, but over the long term it's a weighing machine. One flawed but reasonable way to assess how sentiment around a company has changed is to compare the earnings per share (EPS) with the share price.
During the last year, Public Service Enterprise Group actually saw its earnings per share drop 41%.
Given the share price gain, we doubt the market is measuring progress with EPS. Therefore, it seems likely that investors are putting more weight on metrics other than EPS, at the moment.
Unfortunately Public Service Enterprise Group's fell 12% over twelve months. So using a snapshot of key business metrics doesn't give us a good picture of why the market is bidding up the stock.
The image below shows how earnings and revenue have tracked over time (if you click on the image you can see greater detail).
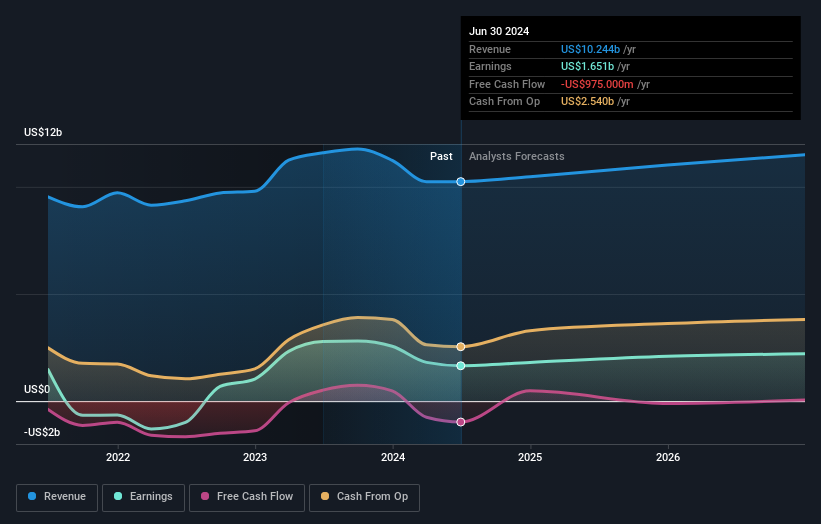
Public Service Enterprise Group is a well known stock, with plenty of analyst coverage, suggesting some visibility into future growth. So it makes a lot of sense to check out what analysts think Public Service Enterprise Group will earn in the future (free analyst consensus estimates)
What About Dividends?
As well as measuring the share price return, investors should also consider the total shareholder return (TSR). Whereas the share price return only reflects the change in the share price, the TSR includes the value of dividends (assuming they were reinvested) and the benefit of any discounted capital raising or spin-off. Arguably, the TSR gives a more comprehensive picture of the return generated by a stock. We note that for Public Service Enterprise Group the TSR over the last 1 year was 67%, which is better than the share price return mentioned above. This is largely a result of its dividend payments!
A Different Perspective
It's nice to see that Public Service Enterprise Group shareholders have received a total shareholder return of 67% over the last year. And that does include the dividend. That's better than the annualised return of 11% over half a decade, implying that the company is doing better recently. Given the share price momentum remains strong, it might be worth taking a closer look at the stock, lest you miss an opportunity. While it is well worth considering the different impacts that market conditions can have on the share price, there are other factors that are even more important. To that end, you should learn about the 4 warning signs we've spotted with Public Service Enterprise Group (including 1 which is potentially serious) .
But note: Public Service Enterprise Group may not be the best stock to buy. So take a peek at this free list of interesting companies with past earnings growth (and further growth forecast).
Please note, the market returns quoted in this article reflect the market weighted average returns of stocks that currently trade on American exchanges.
New: Manage All Your Stock Portfolios in One Place
We've created the ultimate portfolio companion for stock investors, and it's free.
• Connect an unlimited number of Portfolios and see your total in one currency
• Be alerted to new Warning Signs or Risks via email or mobile
• Track the Fair Value of your stocks
Have feedback on this article? Concerned about the content? Get in touch with us directly. Alternatively, email editorial-team (at) simplywallst.com.
This article by Simply Wall St is general in nature. We provide commentary based on historical data and analyst forecasts only using an unbiased methodology and our articles are not intended to be financial advice. It does not constitute a recommendation to buy or sell any stock, and does not take account of your objectives, or your financial situation. We aim to bring you long-term focused analysis driven by fundamental data. Note that our analysis may not factor in the latest price-sensitive company announcements or qualitative material. Simply Wall St has no position in any stocks mentioned.
About NYSE:PEG
Public Service Enterprise Group
Through its subsidiaries, operates in electric and gas utility business in the United States.
Average dividend payer slight.

