Advertisement
- United States
- /
- Electric Utilities
- /
- NasdaqGS:CEG
Is Constellation Energy’s Stock Surge Justified After Climbing 58.7% in 2025?

Simply Wall St
Reviewed by Bailey Pemberton
If you have been tracking Constellation Energy lately, you are not alone. Plenty of investors are eyeing the stock and trying to decide if now is the time to jump in, hold, or trim their exposure. With the share price closing at $384.95, up an impressive 7.3% over the past week and 16.2% in the last month, there is no denying that Constellation has been on a tear. Year to date, the returns are a stunning 58.7%, and over the past three years, shareholders have seen the value of their investment multiply more than threefold.
Much of the recent momentum can be traced back to ongoing shifts in U.S. government policy and sentiment around clean energy. Constellation, positioned as a major player in the nuclear generation space, has benefited from renewed attention to energy security and the perceived advantages of nuclear power as a stable, carbon-free source. While these macro trends have definitely played a role, it's important to ask whether the stock's valuation is keeping pace with its narrative.
That is where things get interesting. According to six standard valuation checks, Constellation Energy scores a 0 out of 6. This means it is not currently considered undervalued by any of the methods. So, is the market getting ahead of itself, or is there more to the story than traditional metrics reveal?
Let’s dig into the details of how the market values Constellation Energy, and why some investors think there may be a smarter way to approach valuation, one that goes beyond just the numbers.
Constellation Energy scores just 0/6 on our valuation checks. See what other red flags we found in the full valuation breakdown.
Approach 1: Constellation Energy Discounted Cash Flow (DCF) Analysis
The Discounted Cash Flow (DCF) model estimates a company’s intrinsic value by forecasting future cash flows and discounting them back to today’s dollars. In essence, it aims to capture the value of all the cash Constellation Energy is expected to generate in the future, adjusted for time and risk.
Based on this approach, Constellation Energy’s latest trailing twelve months Free Cash Flow sits at negative $2.6 Billion, reflecting recent investments or unique financial pressures. Analysts project a sharp turnaround, with Free Cash Flow expected to rise to approximately $4.5 Billion by 2029. After 2029, further growth is extrapolated; it is important to note that only the next five years are shaped by analyst estimates, while additional projections draw on longer-term assumptions from financial research providers.
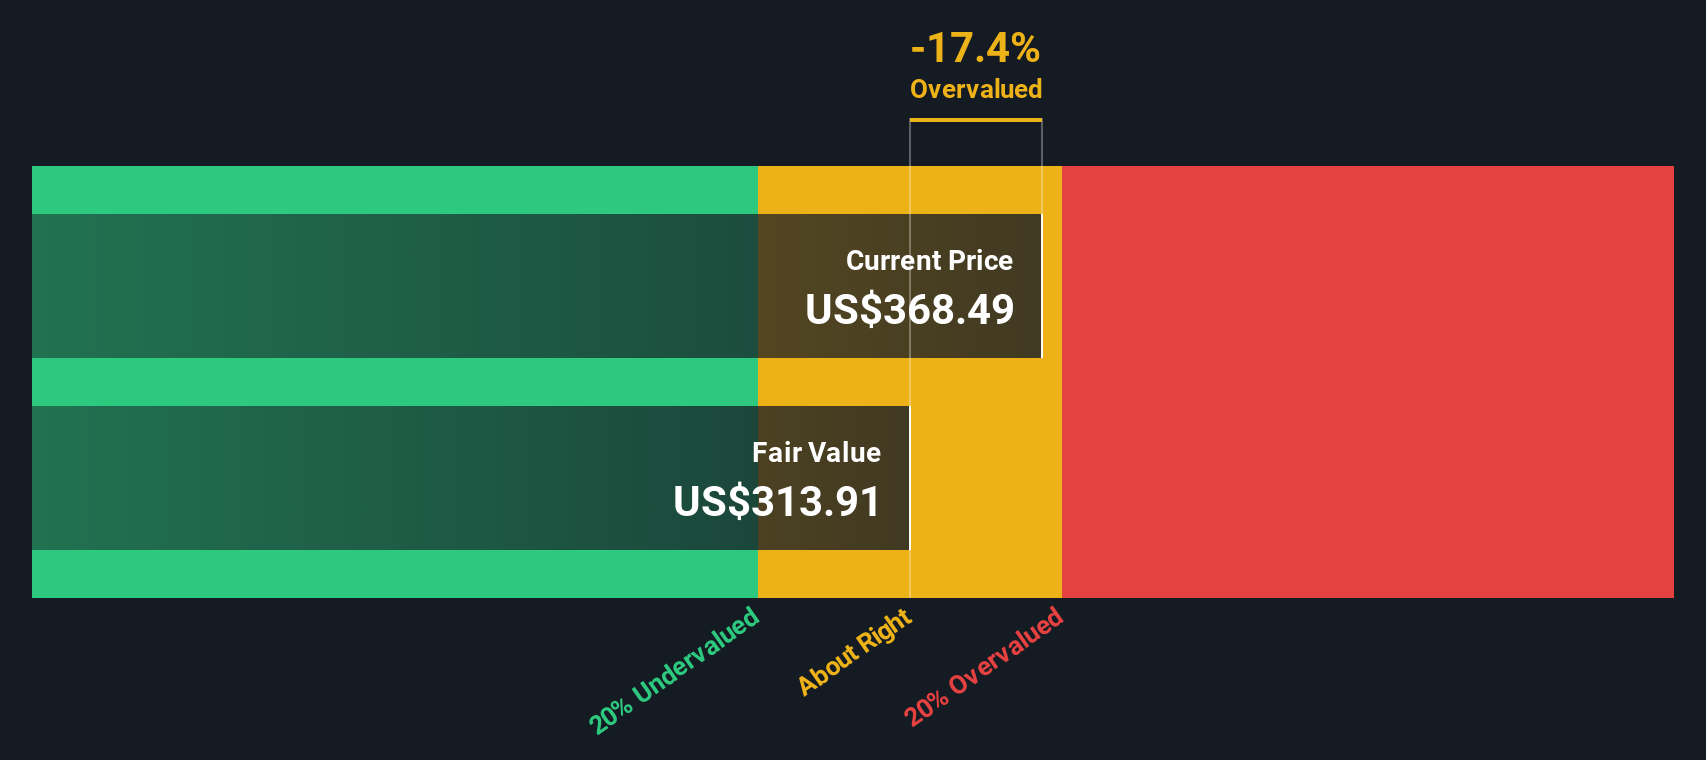
The current DCF-derived intrinsic value per share comes in at $372.98, compared to the actual market price of $384.95. This implies the stock is trading at roughly a 3.2% premium to its projected fair value based on cash flows.
Result: ABOUT RIGHT
Simply Wall St performs a valuation analysis on every stock in the world every day (check out Constellation Energy's valuation analysis). We show the entire calculation in full. You can track the result in your watchlist or portfolio and be alerted when this changes.
Approach 2: Constellation Energy Price vs Earnings
The Price-to-Earnings (PE) ratio is widely regarded as a go-to valuation tool for profitable companies such as Constellation Energy. This metric gives investors a sense of how much they are paying for each dollar of the company’s earnings, serving as a proxy for market expectations around future growth, profitability, and risk.
The "right" PE ratio for a stock depends in part on how quickly a company is expected to grow and the level of risk attached to its earnings. Firms with strong growth prospects or a stable, predictable income stream often command higher PE ratios than slower-growing or riskier peers.
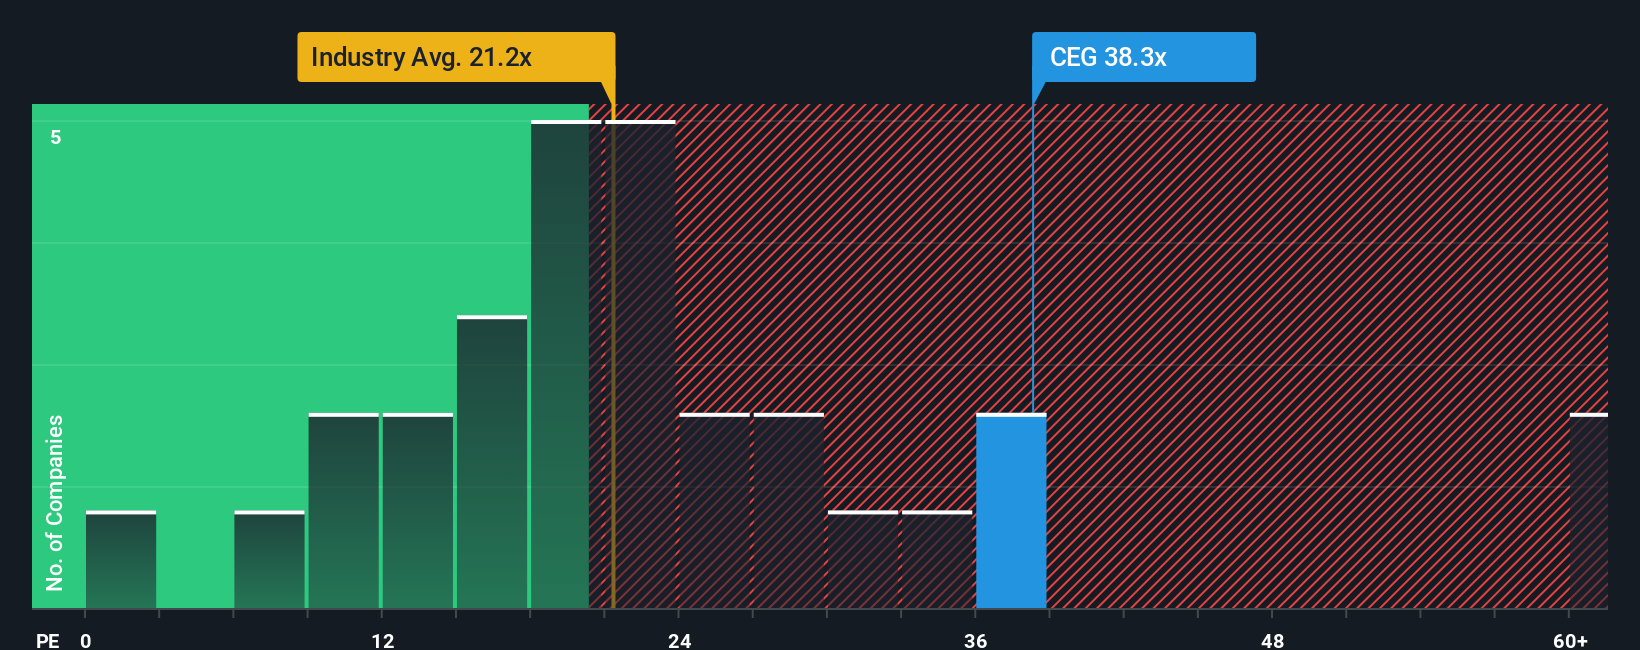
Currently, Constellation Energy trades at a PE ratio of 40x, significantly above the electric utilities industry average of 21.3x and the peer average of 22.7x. On the surface, this premium suggests the market is pricing in robust growth or other positives specific to Constellation. However, benchmarks like the industry average or peer multiples only capture part of the story.
This is where Simply Wall St's "Fair Ratio" comes in. The Fair Ratio is a proprietary measure that estimates the valuation multiple a stock deserves, factoring in its earnings growth, industry dynamics, profit margin, company size, and risk profile. Unlike a simple peer or industry comparison, the Fair Ratio aims to reflect a more nuanced and holistic assessment of value.
For Constellation Energy, the Fair Ratio is 35.7x, only modestly below its current 40x PE ratio. This small difference indicates the current market price is roughly in line with what its growth, risks, and fundamentals warrant. As a result, investors may see the stock as fairly valued by this approach.
Result: ABOUT RIGHT
PE ratios tell one story, but what if the real opportunity lies elsewhere? Discover companies where insiders are betting big on explosive growth.
Upgrade Your Decision Making: Choose Your Constellation Energy Narrative
Earlier, we hinted at a better way to understand valuation, and this is where Narratives come in, offering a smarter, more dynamic approach to investment decisions that goes beyond just crunching the numbers.
A Narrative, in simple terms, is your investment story. It is a structured way for you to connect your knowledge and perspective on a company with concrete forecasts for future revenue, earnings, and margins, all leading to a fair value estimate that actually reflects your thesis. Instead of relying solely on traditional models, Narratives let you link what is happening in the real world, like clean energy policy shifts or new contract wins, with how you think Constellation Energy should perform over time.
On Simply Wall St’s Community page, Narratives are accessible and easy to update. Millions of investors use them to see how their stories translate into fair value, which they can then compare against the current share price to decide when to buy, sell, or hold. Best of all, Narratives are not static; when new news or earnings hit, they update in real time so your picture of Constellation stays relevant.
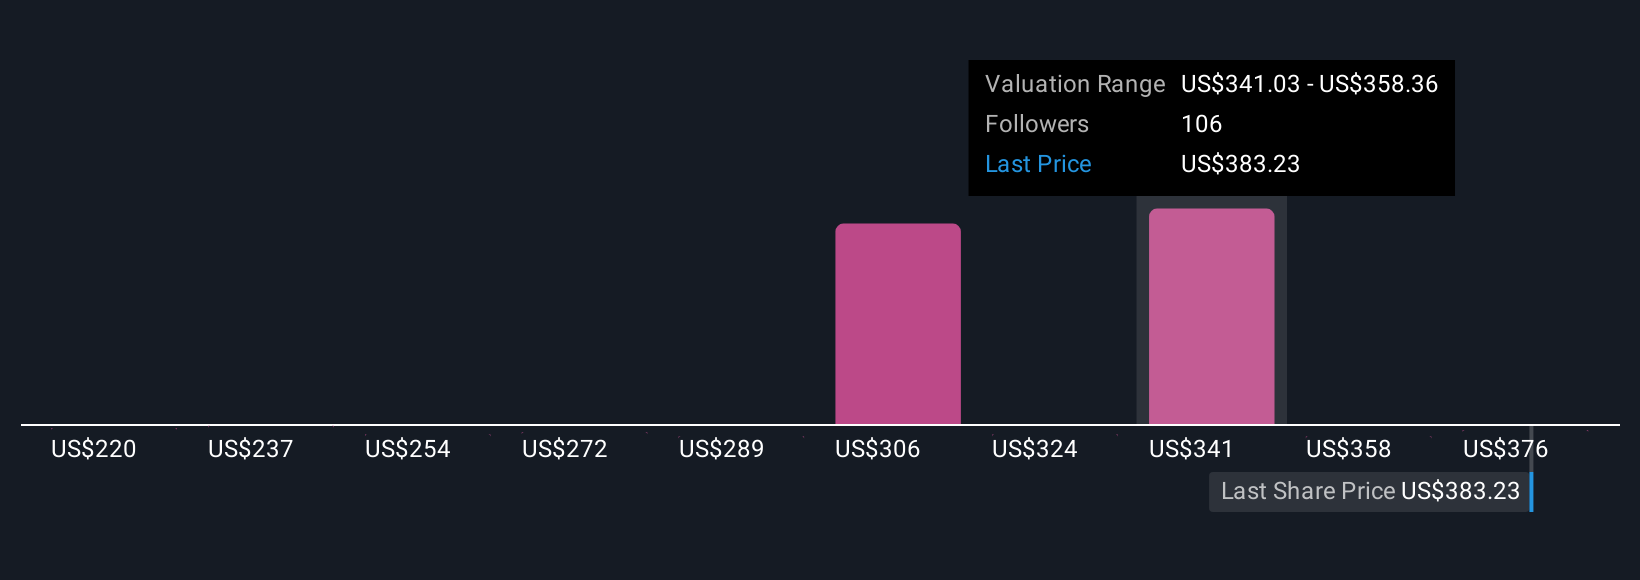
For example, some investors see upside driven by surging data center power demand and new nuclear assets, arriving at bullish price targets as high as $393, while others focus on regulatory or market risks and settle on more cautious targets near $184. This shows just how powerfully perspective can shape your investment actions.
Do you think there's more to the story for Constellation Energy? Create your own Narrative to let the Community know!
This article by Simply Wall St is general in nature. We provide commentary based on historical data and analyst forecasts only using an unbiased methodology and our articles are not intended to be financial advice. It does not constitute a recommendation to buy or sell any stock, and does not take account of your objectives, or your financial situation. We aim to bring you long-term focused analysis driven by fundamental data. Note that our analysis may not factor in the latest price-sensitive company announcements or qualitative material. Simply Wall St has no position in any stocks mentioned.
New: AI Stock Screener & Alerts
Our new AI Stock Screener scans the market every day to uncover opportunities.
• Dividend Powerhouses (3%+ Yield)
• Undervalued Small Caps with Insider Buying
• High growth Tech and AI Companies
Or build your own from over 50 metrics.
Have feedback on this article? Concerned about the content? Get in touch with us directly. Alternatively, email editorial-team@simplywallst.com
About NasdaqGS:CEG
Constellation Energy
Produces and sells energy products and services in the United States.
Proven track record and fair value.
Similar Companies
Market Insights

Advertisement
Community Narratives
The company that turned a verb into a global necessity and basically runs the modern internet, digital ads, smartphones, maps, and AI.
Fair Value US$300.00|7.1% undervalued
OS
Community Contributor
Flowers Foods Pays A Fair Price For Health
Fair Value US$16.12|26.4% undervalued
NV
Community Contributor
TMX Group will thrive with 33.3% profit margin and enduring market moat
Fair Value CA$49.90|0.8% overvalued
LI
Community Contributor
The "Molecular Pencil": Why Beam's Technology is Built to Win
Fair Value US$65.01|65.8% undervalued
DA
Community Contributor