Advertisement
- United States
- /
- Airlines
- /
- NasdaqGS:SKYW
Does SkyWest’s Recent 472.9% Surge Signal Room for More Growth in 2025?

Simply Wall St
Reviewed by Bailey Pemberton
- Ever wondered if SkyWest’s share price reflects its true value, or if there’s something the market might be missing? You’re definitely not alone. There is a lot to explore when it comes to what this stock is really worth.
- Recently, SkyWest’s stock has been relatively stable, with a slight 0.1% gain over the last week but down just 0.6% year-to-date. This follows its significant 472.9% rise over the past three years.
- Market chatter has picked up amid sector-wide optimism and renewed confidence in regional carriers, partly thanks to expanding travel demand and evolving partnerships within the industry. This context helps explain why SkyWest’s price might be shifting now, even though there have not been major headlines recently.
- On our valuation scorecard, SkyWest currently stands at 5 out of 6 for undervaluation checks, making it a standout among its peers. We will look at the different methods used to assess this value shortly, so be sure to read on for an even smarter way to think about fair price at the end of the article.
Find out why SkyWest's -0.8% return over the last year is lagging behind its peers.
Approach 1: SkyWest Discounted Cash Flow (DCF) Analysis
A Discounted Cash Flow (DCF) model estimates a company’s true worth by taking its future cash flows and discounting them back to their value today. This approach gives investors a clearer sense of intrinsic value based on the money the business is expected to generate.
For SkyWest, the model starts with its latest annual Free Cash Flow of $312.5 million. Analyst projections see this growing steadily, reaching $526 million by 2027. Simply Wall St then extrapolates those analyst figures over a total of ten years, foreseeing Free Cash Flow potentially moving above $1 billion by 2035. All these numbers are calculated in USD and reflect both forecasted results by analysts and further estimates using observed trends.
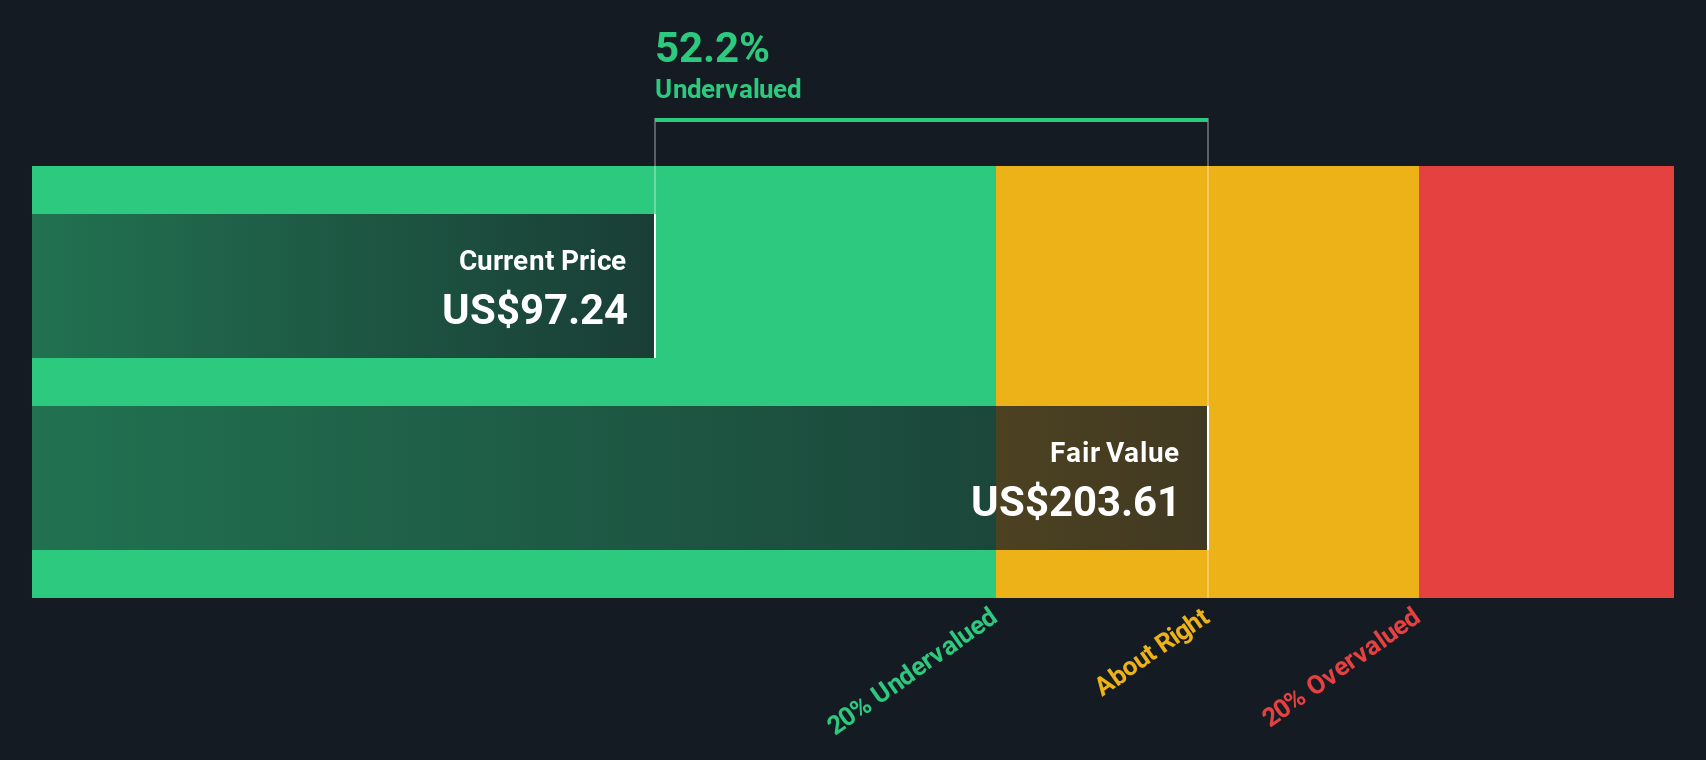
Pulled together and discounted to today’s value, the DCF model calculates an intrinsic value of $257.27 per share. This is a striking 60.9% higher than the current share price, indicating that SkyWest stock may be significantly undervalued at this time.
Result: UNDERVALUED
Our Discounted Cash Flow (DCF) analysis suggests SkyWest is undervalued by 60.9%. Track this in your watchlist or portfolio, or discover 834 more undervalued stocks based on cash flows.
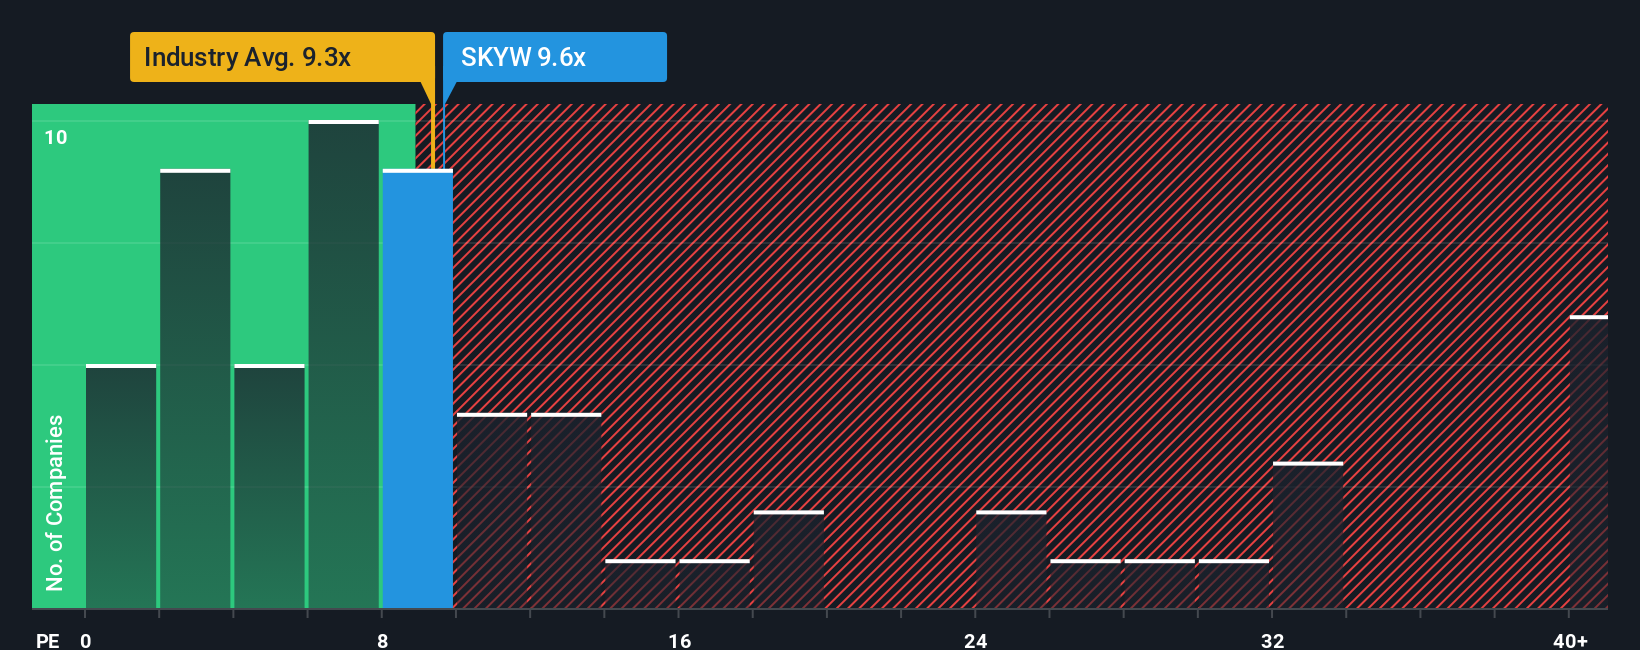
Approach 2: SkyWest Price vs Earnings
The Price-to-Earnings (PE) ratio is often the preferred metric for valuing profitable companies like SkyWest, as it directly links a company's share price to its bottom-line earnings. This makes it easy to gauge what investors are willing to pay for each dollar of profit. A higher PE can reflect expectations for robust future growth, while a lower PE might indicate more risk or less confidence in those prospects.
Currently, SkyWest trades at a PE ratio of 9.95x. This is just above the industry average for airlines, which stands at 8.75x, and significantly below the peer group average of 23.98x. These comparisons suggest that SkyWest may not be getting the same growth premium as top competitors, even though it remains comfortably profitable.
To provide a more tailored benchmark, Simply Wall St calculates a proprietary “Fair Ratio” for SkyWest. In this case, it is 10.92x. Unlike standard industry or peer averages, the Fair Ratio adjusts for unique factors such as SkyWest’s earnings growth outlook, profit margins, size, industry dynamics, and risk profile. This offers a more accurate reflection of what SkyWest's multiple should be in today’s market, giving investors a comprehensive perspective.
SkyWest’s actual PE ratio of 9.95x is very close to its Fair Ratio of 10.92x, suggesting the stock is trading at about the level its fundamentals warrant.
Result: ABOUT RIGHT
PE ratios tell one story, but what if the real opportunity lies elsewhere? Discover 1410 companies where insiders are betting big on explosive growth.
Upgrade Your Decision Making: Choose your SkyWest Narrative
Earlier we mentioned that there is an even better way to understand valuation. Let's introduce you to Narratives. A Narrative is your own story behind a company's numbers, connecting your personal perspective on future revenue, earnings, and margins with an assumed fair value. Instead of relying only on static metrics, Narratives bring together the company’s business story, your expectations, and financial forecasts into one easy-to-use tool, available on Simply Wall St’s Community page and trusted by millions of investors.
Narratives help you decide when to buy or sell by comparing your own Fair Value to today’s market price. This approach dynamically updates as new earnings, news, or events change the picture. For SkyWest, some investors see strong demand and fleet modernization supporting much higher fair values, while others worry about risks like pilot shortages or rising costs, resulting in a more cautious view. Narratives give you the power to tailor your decision-making to your unique view, making it simple and accessible to track how new developments could change your fair value estimate in real time.
Do you think there's more to the story for SkyWest? Head over to our Community to see what others are saying!
This article by Simply Wall St is general in nature. We provide commentary based on historical data and analyst forecasts only using an unbiased methodology and our articles are not intended to be financial advice. It does not constitute a recommendation to buy or sell any stock, and does not take account of your objectives, or your financial situation. We aim to bring you long-term focused analysis driven by fundamental data. Note that our analysis may not factor in the latest price-sensitive company announcements or qualitative material. Simply Wall St has no position in any stocks mentioned.
New: Manage All Your Stock Portfolios in One Place
We've created the ultimate portfolio companion for stock investors, and it's free.
• Connect an unlimited number of Portfolios and see your total in one currency
• Be alerted to new Warning Signs or Risks via email or mobile
• Track the Fair Value of your stocks
Have feedback on this article? Concerned about the content? Get in touch with us directly. Alternatively, email editorial-team@simplywallst.com
About NasdaqGS:SKYW
SkyWest
Through its subsidiaries, engages in the operation of a regional airline in the United States.
Undervalued with solid track record.
Similar Companies
Market Insights

Advertisement
Community Narratives
The company that turned a verb into a global necessity and basically runs the modern internet, digital ads, smartphones, maps, and AI.
Fair Value US$300.00|6.2% undervalued
OS
Community Contributor
Flowers Foods Pays A Fair Price For Health
Fair Value US$16.12|26.0% undervalued
NV
Community Contributor
TMX Group will thrive with 33.3% profit margin and enduring market moat
Fair Value CA$49.90|3.7% overvalued
LI
Community Contributor