Stock Analysis
- United States
- /
- Wireless Telecom
- /
- NasdaqGS:TMUS
Investors in T-Mobile US (NASDAQ:TMUS) have seen impressive returns of 126% over the past five years

When you buy shares in a company, it's worth keeping in mind the possibility that it could fail, and you could lose your money. But on a lighter note, a good company can see its share price rise well over 100%. For instance, the price of T-Mobile US, Inc. (NASDAQ:TMUS) stock is up an impressive 123% over the last five years.
So let's investigate and see if the longer term performance of the company has been in line with the underlying business' progress.
View our latest analysis for T-Mobile US
In his essay The Superinvestors of Graham-and-Doddsville Warren Buffett described how share prices do not always rationally reflect the value of a business. One way to examine how market sentiment has changed over time is to look at the interaction between a company's share price and its earnings per share (EPS).
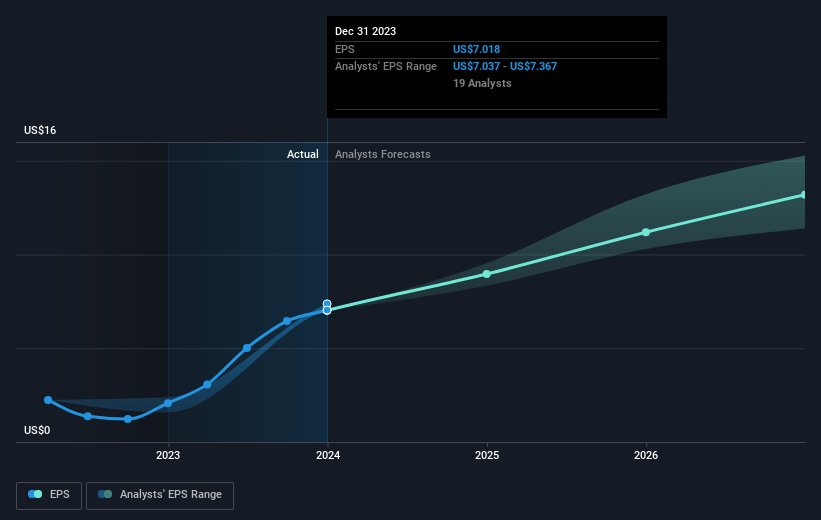
Over half a decade, T-Mobile US managed to grow its earnings per share at 16% a year. This EPS growth is reasonably close to the 17% average annual increase in the share price. This indicates that investor sentiment towards the company has not changed a great deal. Indeed, it would appear the share price is reacting to the EPS.
The graphic below depicts how EPS has changed over time (unveil the exact values by clicking on the image).
It is of course excellent to see how T-Mobile US has grown profits over the years, but the future is more important for shareholders. This free interactive report on T-Mobile US' balance sheet strength is a great place to start, if you want to investigate the stock further.
What About Dividends?
When looking at investment returns, it is important to consider the difference between total shareholder return (TSR) and share price return. The TSR is a return calculation that accounts for the value of cash dividends (assuming that any dividend received was reinvested) and the calculated value of any discounted capital raisings and spin-offs. Arguably, the TSR gives a more comprehensive picture of the return generated by a stock. We note that for T-Mobile US the TSR over the last 5 years was 126%, which is better than the share price return mentioned above. This is largely a result of its dividend payments!
A Different Perspective
T-Mobile US provided a TSR of 19% over the last twelve months. But that was short of the market average. On the bright side, that's still a gain, and it's actually better than the average return of 18% over half a decade It is possible that returns will improve along with the business fundamentals. It's always interesting to track share price performance over the longer term. But to understand T-Mobile US better, we need to consider many other factors. Even so, be aware that T-Mobile US is showing 3 warning signs in our investment analysis , you should know about...
If you would prefer to check out another company -- one with potentially superior financials -- then do not miss this free list of companies that have proven they can grow earnings.
Please note, the market returns quoted in this article reflect the market weighted average returns of stocks that currently trade on American exchanges.
Valuation is complex, but we're helping make it simple.
Find out whether T-Mobile US is potentially over or undervalued by checking out our comprehensive analysis, which includes fair value estimates, risks and warnings, dividends, insider transactions and financial health.
View the Free AnalysisHave feedback on this article? Concerned about the content? Get in touch with us directly. Alternatively, email editorial-team (at) simplywallst.com.
This article by Simply Wall St is general in nature. We provide commentary based on historical data and analyst forecasts only using an unbiased methodology and our articles are not intended to be financial advice. It does not constitute a recommendation to buy or sell any stock, and does not take account of your objectives, or your financial situation. We aim to bring you long-term focused analysis driven by fundamental data. Note that our analysis may not factor in the latest price-sensitive company announcements or qualitative material. Simply Wall St has no position in any stocks mentioned.
About NasdaqGS:TMUS
T-Mobile US
T-Mobile US, Inc., together with its subsidiaries, provides mobile communications services in the United States, Puerto Rico, and the United States Virgin Islands.
Solid track record second-rate dividend payer.

