Advertisement
- United States
- /
- Telecom Services and Carriers
- /
- NasdaqGS:ASTS
Assessing AST SpaceMobile After Its 220% 2025 Rally and Satellite Launch Progress

Simply Wall St
Reviewed by Bailey Pemberton
- If you have ever wondered whether AST SpaceMobile's meteoric rise means it is actually undervalued or just riding a wave of excitement, you are not alone.
- The stock has climbed a staggering 219.7% year-to-date and is up 179.4% over the last 12 months, though it recently dipped by 15.7% in the past month.
- Recent headlines about AST SpaceMobile's progress on satellite launches and partnerships with major telecoms are fueling fresh optimism. This helps explain the stock's big moves, as investors seem to be weighing new breakthroughs in connectivity against lingering questions about commercialization.
- On a basic valuation check, AST SpaceMobile scores just 2 out of 6 for being undervalued. This suggests there is more to unpack beyond the surface numbers, especially when looking at different valuation models and a smarter way to assess value at the end of this article.
AST SpaceMobile scores just 2/6 on our valuation checks. See what other red flags we found in the full valuation breakdown.
Approach 1: AST SpaceMobile Discounted Cash Flow (DCF) Analysis
A Discounted Cash Flow (DCF) analysis estimates a company's intrinsic value by projecting its future cash flows and discounting them to today's value. The model begins with AST SpaceMobile's current Free Cash Flow, which stands at negative $483 million, reflecting significant ongoing investments.
Analyst estimates foresee continued negative cash flows in the near term, but optimism builds toward 2028 and beyond. For example, projected Free Cash Flow in 2029 is $766.6 million and, based on extrapolated estimates, could surpass $4.3 billion by 2035. These projections are based on a two-stage Free Cash Flow to Equity model, which captures both analyst forecasts for the next five years and broader growth assumptions for the subsequent years. All cash flows are reported in US dollars.
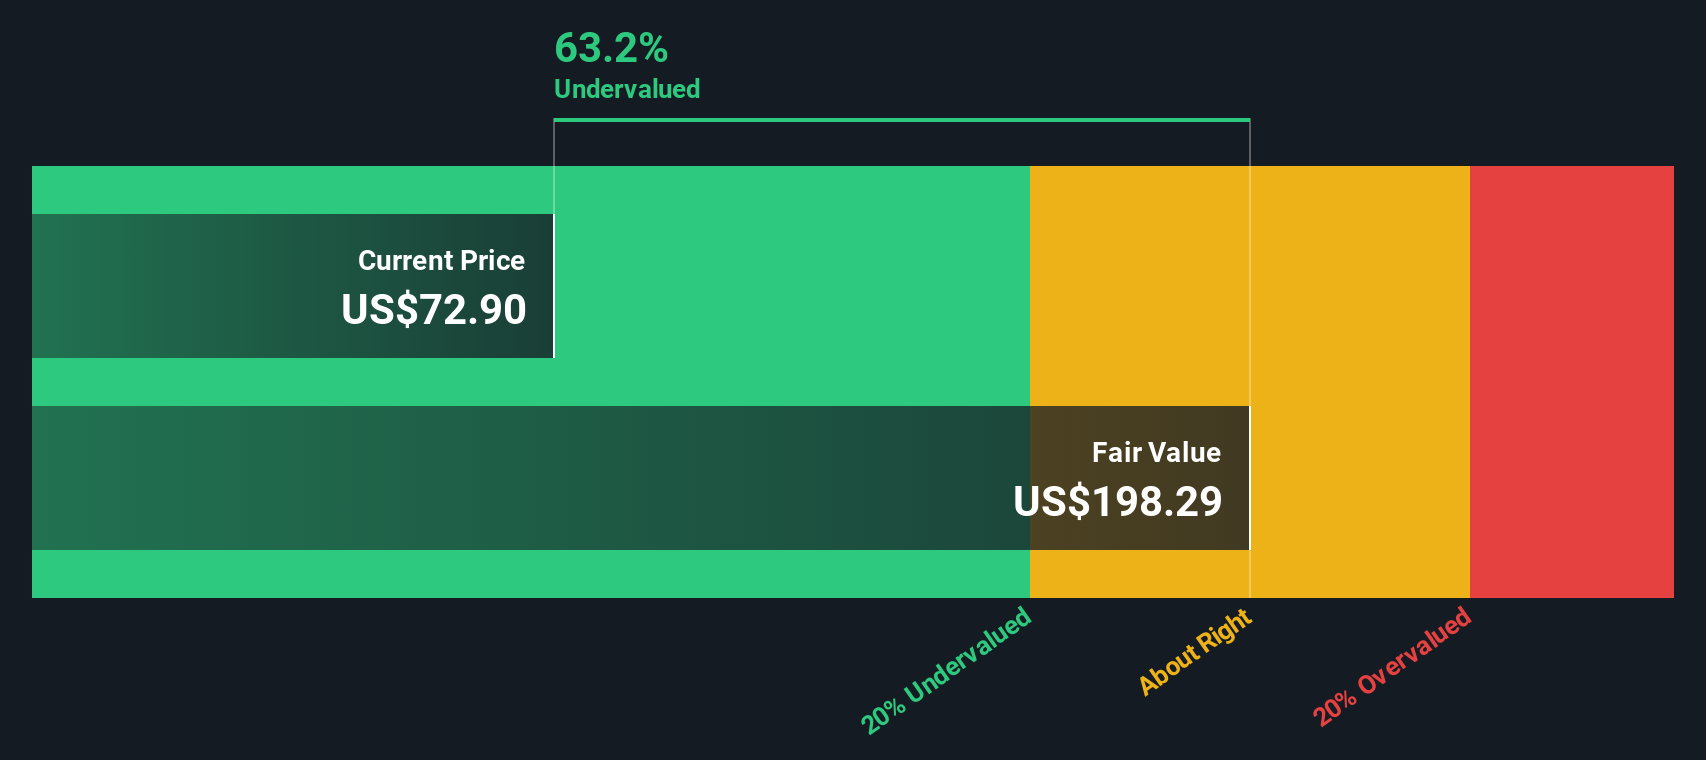
This DCF approach calculates an intrinsic value of $195.17 per share, which is about 64.5% higher than AST SpaceMobile's current market price. This suggests the stock is significantly undervalued and that the market may be underestimating the company’s future cash generation capabilities if all goes as projected.
Result: UNDERVALUED
Our Discounted Cash Flow (DCF) analysis suggests AST SpaceMobile is undervalued by 64.5%. Track this in your watchlist or portfolio, or discover 881 more undervalued stocks based on cash flows.
Approach 2: AST SpaceMobile Price vs Book
The Price-to-Book (PB) ratio is often the go-to valuation metric for companies like AST SpaceMobile that are not yet profitable. This is because it focuses on the value of the company’s assets rather than its bottom-line earnings. The PB ratio is particularly useful for newer or high-investment businesses still working toward positive earnings.
Growth prospects and company-specific risks often shape what a "normal" PB ratio should be. Companies expected to grow quickly or that own unique assets can command above-average multiples. In contrast, higher risk or slower-growth businesses may deserve lower ones. Because of this, it is important to measure AST SpaceMobile’s PB ratio against appropriate benchmarks.
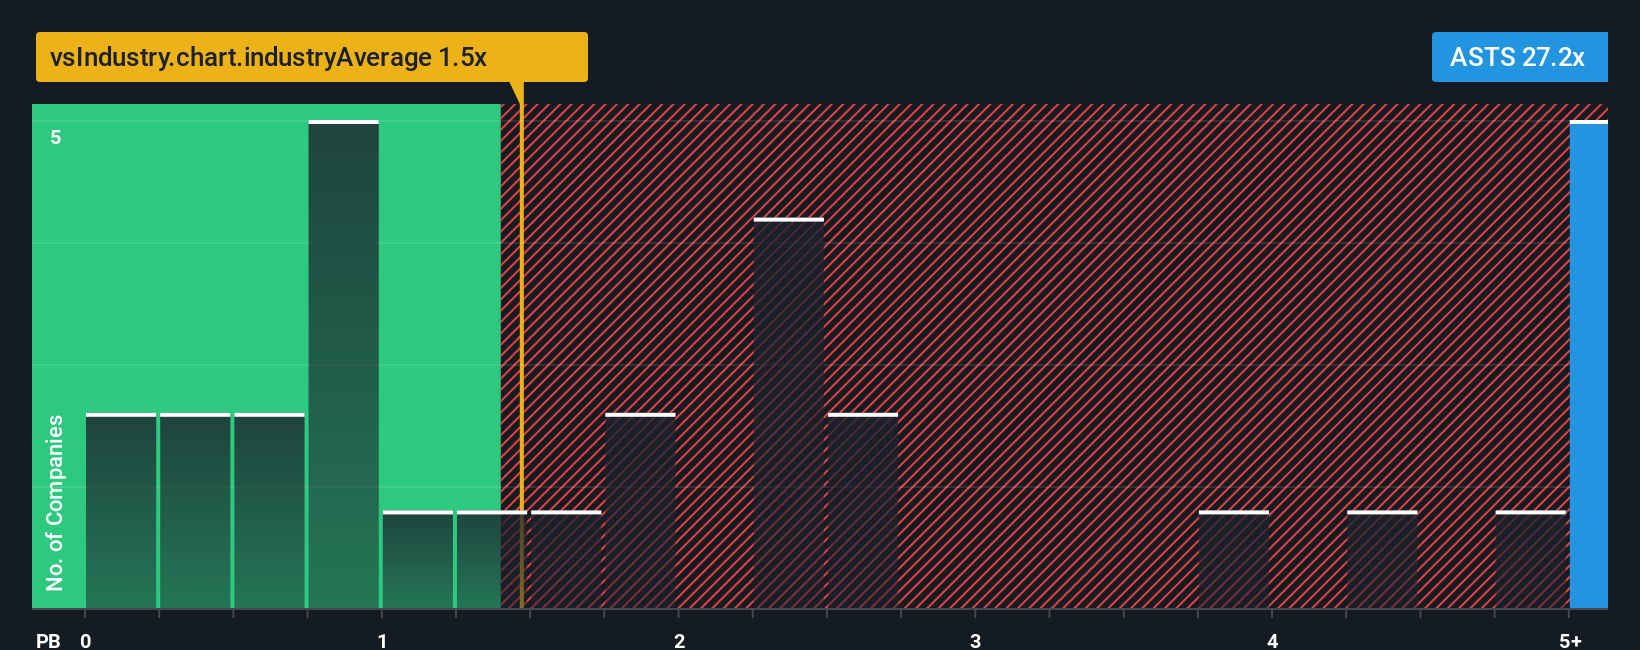
Currently, AST SpaceMobile is trading at a PB ratio of 22.07x, far above both the telecom industry average of 1.11x and the peer average of 5.29x. At first glance, this suggests the stock is extremely expensive compared to its sector.
This is where the Simply Wall St “Fair Ratio” comes in. The Fair Ratio is a data-driven estimate of what an appropriate PB multiple should be, tailored for a company’s growth potential, industry, margin profile, market cap, and risk factors. It provides a more refined baseline than just industry averages or peer group numbers, since those do not capture AST SpaceMobile’s unique story and ambitions.
Comparing AST SpaceMobile’s current PB ratio of 22.07x to its Fair Ratio, the stock is OVERVALUED, even when taking growth prospects and company specifics into account.
Result: OVERVALUED
PB ratios tell one story, but what if the real opportunity lies elsewhere? Discover 1404 companies where insiders are betting big on explosive growth.
Upgrade Your Decision Making: Choose your AST SpaceMobile Narrative
Earlier we mentioned that there is an even better way to understand valuation, so let us introduce you to Narratives. A Narrative is a simple and powerful tool that lets you connect your view of a company’s story, including your assumptions about future revenue, earnings, and margins, to a specific fair value estimate. It bridges the gap between headline numbers and personal perspective by allowing you to see the financial impact behind your expectations.
On Simply Wall St's Community page, used by millions of investors, Narratives make it easy for anyone to build and compare forecasts without needing advanced finance skills. By creating or exploring different Narratives, you can see when a fair value signals it might be time to buy or sell compared to the current price. Since Narratives update automatically when news or earnings arrive, your analysis stays relevant.
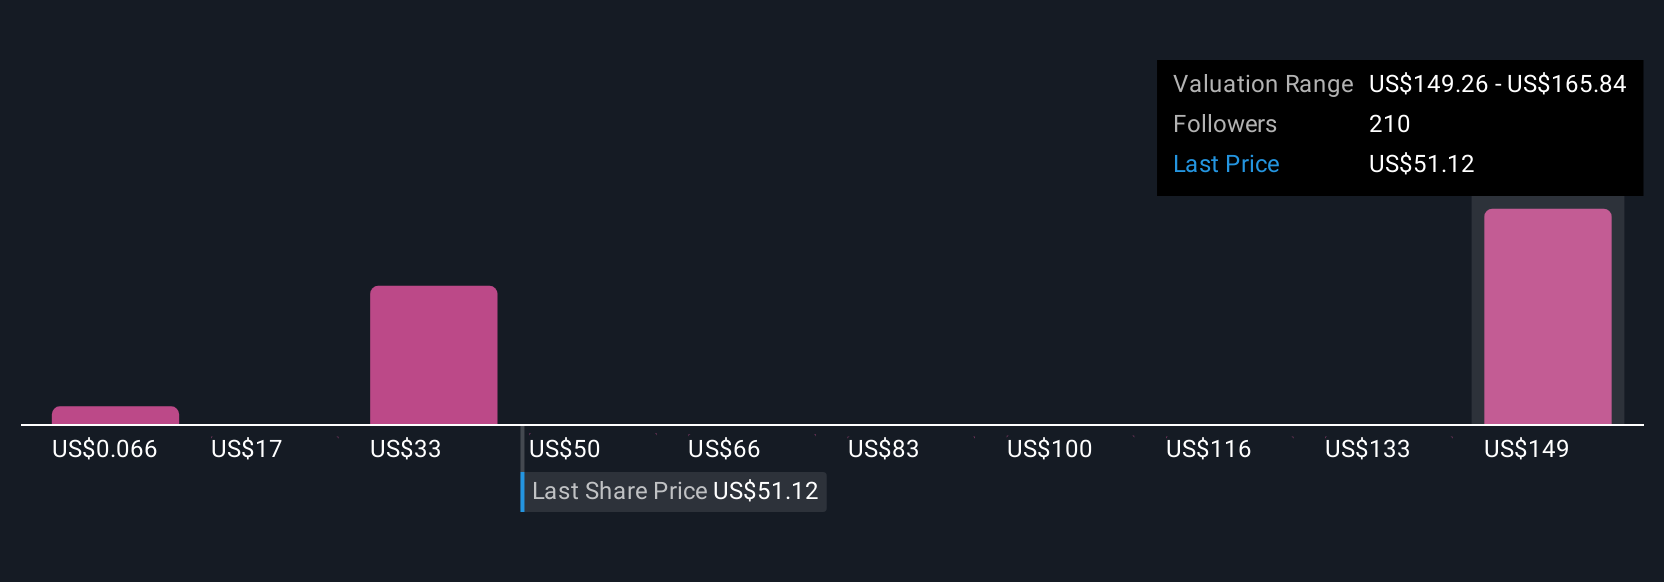
For example, some investors might believe AST SpaceMobile’s potential justifies its highest fair value projections, while others use the lowest forecasts to stay cautiously realistic. Both perspectives are just one Narrative among many you can compare.
Do you think there's more to the story for AST SpaceMobile? Head over to our Community to see what others are saying!
This article by Simply Wall St is general in nature. We provide commentary based on historical data and analyst forecasts only using an unbiased methodology and our articles are not intended to be financial advice. It does not constitute a recommendation to buy or sell any stock, and does not take account of your objectives, or your financial situation. We aim to bring you long-term focused analysis driven by fundamental data. Note that our analysis may not factor in the latest price-sensitive company announcements or qualitative material. Simply Wall St has no position in any stocks mentioned.
New: Manage All Your Stock Portfolios in One Place
We've created the ultimate portfolio companion for stock investors, and it's free.
• Connect an unlimited number of Portfolios and see your total in one currency
• Be alerted to new Warning Signs or Risks via email or mobile
• Track the Fair Value of your stocks
Have feedback on this article? Concerned about the content? Get in touch with us directly. Alternatively, email editorial-team@simplywallst.com
About NasdaqGS:ASTS
AST SpaceMobile
Designs and develops the constellation of BlueBird satellites in the United States.
Exceptional growth potential with excellent balance sheet.
Similar Companies
Market Insights

Advertisement
Community Narratives
The "Molecular Pencil": Why Beam's Technology is Built to Win
Fair Value US$65.01|65.8% undervalued
DA
Community Contributor
The silent giant behind virtually every advanced chip powering AI, smartphones, and modern infrastructure.
Fair Value US$310.00|7.6% undervalued
OS
Community Contributor
ADP Stock: Solid Fundamentals, But AI Investments Test Its Margin Resilience
Fair Value US$387.77|34.5% undervalued
YI
Community Contributor