Advertisement
Ralliant (RAL): Evaluating Valuation After Latest Financial Results and Share Price Rebound

Simply Wall St
Reviewed by Simply Wall St
Ralliant (RAL) recently delivered its latest financial update, offering investors a look at revenue and net income trends over the past year. The company’s steady annual growth in both metrics is likely to prompt closer analysis from the market.
See our latest analysis for Ralliant.
Ralliant’s share price momentum has picked up lately, with a 12.6% gain over the past month and a solid 6.2% rise this week, pushing the stock to $46.65. While year-to-date returns remain slightly negative, the short-term surge hints at renewed optimism around the company’s growth prospects as investors digest its results.
If the recent rebound in Ralliant’s performance has you rethinking your investing strategy, now is a perfect time to broaden your search and discover fast growing stocks with high insider ownership
With Ralliant's shares now trading just below analyst price targets, investors are left to wonder whether there is still upside potential to be realized or if the market has already factored in the company’s future growth.
Price-to-Earnings of 22.5: Is it justified?
At a price-to-earnings ratio of 22.5, Ralliant trades slightly below both its US Electronic industry peers and the broader market. This reflects a potential value opportunity given the last close of $46.65.
The price-to-earnings (P/E) ratio measures what investors are willing to pay today for a dollar of the company’s current earnings. It is a commonly used tool for technology and electronic companies, where investors weigh current profitability against anticipated growth and sector averages.
Given Ralliant's P/E ratio is lower than both the US Electronic industry average of 25.3x and the peer average of 40.9x, the market appears to be underpricing its expected earnings. This suggests investors might not be fully recognizing Ralliant's future growth trajectory or are factoring in other concerns, such as its recent net margin declines or management turnover.
Comparatively, the market is valuing similar companies more generously. As a result, Ralliant’s shares may attract value-focused investors seeking a relative discount in the sector.
See what the numbers say about this price — find out in our valuation breakdown.
Result: Price-to-Earnings of 22.5 (UNDERVALUED)
However, persistent net margin declines or further management turnover could shift investor sentiment and challenge the narrative of Ralliant's undervaluation in the future.
Find out about the key risks to this Ralliant narrative.
Another View: SWS DCF Model Offers a Fresh Perspective
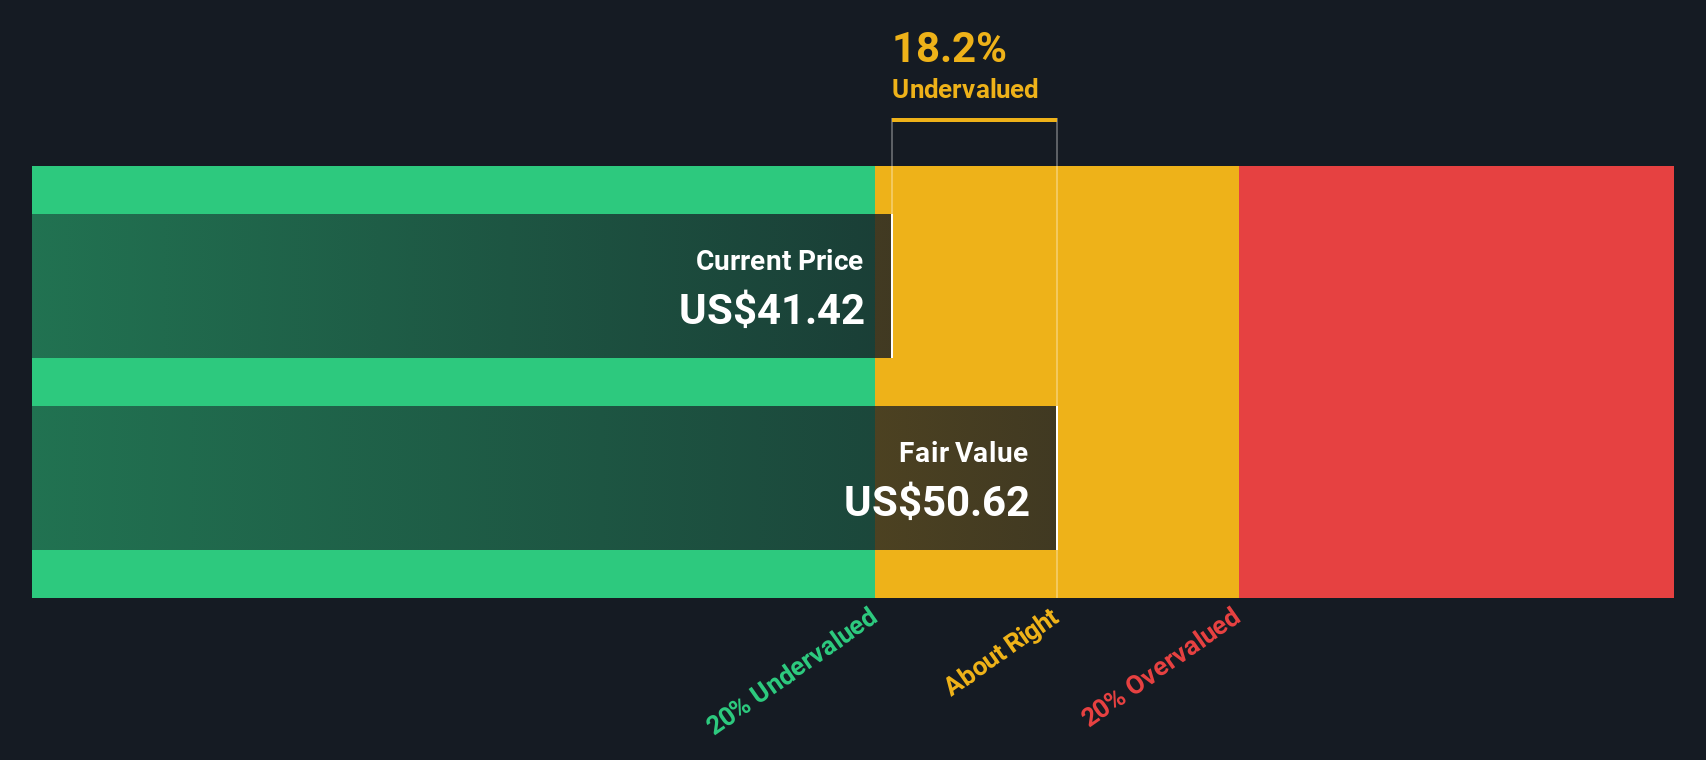
To look at Ralliant’s value another way, our DCF model puts the company’s fair value at $49.66, a 6.1% premium over today’s $46.65 price. This perspective suggests Ralliant might be undervalued. However, how reliable is this estimate compared to market sentiment?
Look into how the SWS DCF model arrives at its fair value.
Simply Wall St performs a discounted cash flow (DCF) on every stock in the world every day (check out Ralliant for example). We show the entire calculation in full. You can track the result in your watchlist or portfolio and be alerted when this changes, or use our stock screener to discover 876 undervalued stocks based on their cash flows. If you save a screener we even alert you when new companies match - so you never miss a potential opportunity.
Build Your Own Ralliant Narrative
If you see the numbers differently or prefer to reach your own conclusions, it's quick and easy to craft your own analysis in under three minutes. Do it your way
A great starting point for your Ralliant research is our analysis highlighting 2 key rewards and 1 important warning sign that could impact your investment decision.
Looking for more investment ideas?
Jump on the fastest-moving opportunities by using our powerful screener tools. Your next smart investment move could be just a click away, so don’t wait and take control of your search today.
- Supercharge your portfolio with growth-focused companies by tapping into these 25 AI penny stocks and see which innovators are making waves in artificial intelligence.
- Boost your passive income potential by checking out these 16 dividend stocks with yields > 3% featuring businesses offering strong yields above 3 percent.
- Ride the momentum of the digital revolution and get exposure to new-age finance through these 82 cryptocurrency and blockchain stocks.
This article by Simply Wall St is general in nature. We provide commentary based on historical data and analyst forecasts only using an unbiased methodology and our articles are not intended to be financial advice. It does not constitute a recommendation to buy or sell any stock, and does not take account of your objectives, or your financial situation. We aim to bring you long-term focused analysis driven by fundamental data. Note that our analysis may not factor in the latest price-sensitive company announcements or qualitative material. Simply Wall St has no position in any stocks mentioned.
New: AI Stock Screener & Alerts
Our new AI Stock Screener scans the market every day to uncover opportunities.
• Dividend Powerhouses (3%+ Yield)
• Undervalued Small Caps with Insider Buying
• High growth Tech and AI Companies
Or build your own from over 50 metrics.
Have feedback on this article? Concerned about the content? Get in touch with us directly. Alternatively, email editorial-team@simplywallst.com
About NYSE:RAL
Ralliant
Engages in the design, development, manufacture, sale, and service of precision instruments and engineered products in the United States, China, Western Europe, and internationally.
Adequate balance sheet and fair value.
Similar Companies
Market Insights

Advertisement
Community Narratives
The company that turned a verb into a global necessity and basically runs the modern internet, digital ads, smartphones, maps, and AI.
Fair Value US$300.00|7.1% undervalued
OS
Community Contributor
Flowers Foods Pays A Fair Price For Health
Fair Value US$16.12|26.4% undervalued
NV
Community Contributor
TMX Group will thrive with 33.3% profit margin and enduring market moat
Fair Value CA$49.90|0.8% overvalued
LI
Community Contributor
The "Molecular Pencil": Why Beam's Technology is Built to Win
Fair Value US$65.01|65.8% undervalued
DA
Community Contributor