Advertisement
- United States
- /
- Electronic Equipment and Components
- /
- NasdaqGS:PLUS
ePlus inc.'s (NASDAQ:PLUS) Intrinsic Value Is Potentially 24% Below Its Share Price
Key Insights
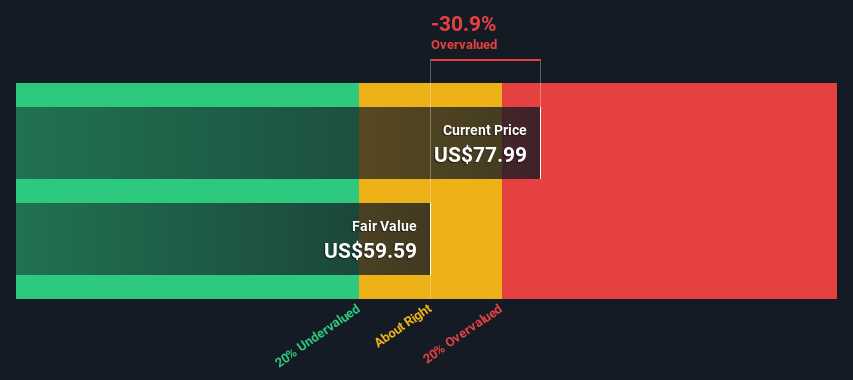
- Using the 2 Stage Free Cash Flow to Equity, ePlus fair value estimate is US$59.59
- Current share price of US$77.99 suggests ePlus is potentially 31% overvalued
- Our fair value estimate is 19% lower than ePlus' analyst price target of US$74.00
In this article we are going to estimate the intrinsic value of ePlus inc. (NASDAQ:PLUS) by estimating the company's future cash flows and discounting them to their present value. This will be done using the Discounted Cash Flow (DCF) model. There's really not all that much to it, even though it might appear quite complex.
Companies can be valued in a lot of ways, so we would point out that a DCF is not perfect for every situation. For those who are keen learners of equity analysis, the Simply Wall St analysis model here may be something of interest to you.
View our latest analysis for ePlus
Is ePlus Fairly Valued?
We're using the 2-stage growth model, which simply means we take in account two stages of company's growth. In the initial period the company may have a higher growth rate and the second stage is usually assumed to have a stable growth rate. To start off with, we need to estimate the next ten years of cash flows. Where possible we use analyst estimates, but when these aren't available we extrapolate the previous free cash flow (FCF) from the last estimate or reported value. We assume companies with shrinking free cash flow will slow their rate of shrinkage, and that companies with growing free cash flow will see their growth rate slow, over this period. We do this to reflect that growth tends to slow more in the early years than it does in later years.
Generally we assume that a dollar today is more valuable than a dollar in the future, so we discount the value of these future cash flows to their estimated value in today's dollars:
10-year free cash flow (FCF) estimate
| 2024 | 2025 | 2026 | 2027 | 2028 | 2029 | 2030 | 2031 | 2032 | 2033 | |
| Levered FCF ($, Millions) | US$47.8m | US$92.0m | US$95.4m | US$98.6m | US$101.5m | US$104.3m | US$106.9m | US$109.6m | US$112.2m | US$114.8m |
| Growth Rate Estimate Source | Analyst x1 | Analyst x1 | Est @ 3.73% | Est @ 3.28% | Est @ 2.96% | Est @ 2.74% | Est @ 2.58% | Est @ 2.47% | Est @ 2.40% | Est @ 2.34% |
| Present Value ($, Millions) Discounted @ 8.0% | US$44.3 | US$78.9 | US$75.8 | US$72.5 | US$69.2 | US$65.8 | US$62.5 | US$59.3 | US$56.3 | US$53.3 |
("Est" = FCF growth rate estimated by Simply Wall St)
Present Value of 10-year Cash Flow (PVCF) = US$638m
We now need to calculate the Terminal Value, which accounts for all the future cash flows after this ten year period. For a number of reasons a very conservative growth rate is used that cannot exceed that of a country's GDP growth. In this case we have used the 5-year average of the 10-year government bond yield (2.2%) to estimate future growth. In the same way as with the 10-year 'growth' period, we discount future cash flows to today's value, using a cost of equity of 8.0%.
Terminal Value (TV)= FCF2033 × (1 + g) ÷ (r – g) = US$115m× (1 + 2.2%) ÷ (8.0%– 2.2%) = US$2.0b
Present Value of Terminal Value (PVTV)= TV / (1 + r)10= US$2.0b÷ ( 1 + 8.0%)10= US$948m
The total value is the sum of cash flows for the next ten years plus the discounted terminal value, which results in the Total Equity Value, which in this case is US$1.6b. The last step is to then divide the equity value by the number of shares outstanding. Compared to the current share price of US$78.0, the company appears reasonably expensive at the time of writing. Valuations are imprecise instruments though, rather like a telescope - move a few degrees and end up in a different galaxy. Do keep this in mind.
The Assumptions
Now the most important inputs to a discounted cash flow are the discount rate, and of course, the actual cash flows. If you don't agree with these result, have a go at the calculation yourself and play with the assumptions. The DCF also does not consider the possible cyclicality of an industry, or a company's future capital requirements, so it does not give a full picture of a company's potential performance. Given that we are looking at ePlus as potential shareholders, the cost of equity is used as the discount rate, rather than the cost of capital (or weighted average cost of capital, WACC) which accounts for debt. In this calculation we've used 8.0%, which is based on a levered beta of 1.150. Beta is a measure of a stock's volatility, compared to the market as a whole. We get our beta from the industry average beta of globally comparable companies, with an imposed limit between 0.8 and 2.0, which is a reasonable range for a stable business.
SWOT Analysis for ePlus
Strength
- Earnings growth over the past year exceeded the industry.
- Debt is not viewed as a risk.
Weakness
- No major weaknesses identified for PLUS.
Opportunity
- Good value based on P/E ratio compared to estimated Fair P/E ratio.
Threat
- Annual earnings are forecast to decline for the next 2 years.
Next Steps:
Whilst important, the DCF calculation ideally won't be the sole piece of analysis you scrutinize for a company. It's not possible to obtain a foolproof valuation with a DCF model. Instead the best use for a DCF model is to test certain assumptions and theories to see if they would lead to the company being undervalued or overvalued. If a company grows at a different rate, or if its cost of equity or risk free rate changes sharply, the output can look very different. Can we work out why the company is trading at a premium to intrinsic value? For ePlus, we've compiled three fundamental aspects you should consider:
- Risks: Be aware that ePlus is showing 1 warning sign in our investment analysis , you should know about...
- Future Earnings: How does PLUS's growth rate compare to its peers and the wider market? Dig deeper into the analyst consensus number for the upcoming years by interacting with our free analyst growth expectation chart.
- Other Solid Businesses: Low debt, high returns on equity and good past performance are fundamental to a strong business. Why not explore our interactive list of stocks with solid business fundamentals to see if there are other companies you may not have considered!
PS. The Simply Wall St app conducts a discounted cash flow valuation for every stock on the NASDAQGS every day. If you want to find the calculation for other stocks just search here.
New: Manage All Your Stock Portfolios in One Place
We've created the ultimate portfolio companion for stock investors, and it's free.
• Connect an unlimited number of Portfolios and see your total in one currency
• Be alerted to new Warning Signs or Risks via email or mobile
• Track the Fair Value of your stocks
Have feedback on this article? Concerned about the content? Get in touch with us directly. Alternatively, email editorial-team (at) simplywallst.com.
This article by Simply Wall St is general in nature. We provide commentary based on historical data and analyst forecasts only using an unbiased methodology and our articles are not intended to be financial advice. It does not constitute a recommendation to buy or sell any stock, and does not take account of your objectives, or your financial situation. We aim to bring you long-term focused analysis driven by fundamental data. Note that our analysis may not factor in the latest price-sensitive company announcements or qualitative material. Simply Wall St has no position in any stocks mentioned.
About NasdaqGS:PLUS
ePlus
Provides information technology (IT) solutions that enable organizations to optimize IT environment and supply chain processes in the United States and internationally.
Excellent balance sheet and good value.
Similar Companies
Market Insights


Advertisement
Weekly Picks
ST


stuart_roberts on Upside Gold ·
An Undervalued 3.3Moz Gold Project in Canada
Fair Value:CA$5.0774.4% undervalued
214 followersusers have followed this narrative
1 commentusers have commented on this narrative
30 likesusers have liked this narrative
SI


SimpleMan887 on GameStop ·
GameStop will ace the financial crisis wave with its strategic Bitcoin investment and cash reserves
Fair Value:US$22089.4% undervalued
55 followersusers have followed this narrative
2 commentsusers have commented on this narrative
21 likesusers have liked this narrative
YI

yiannisz on Hesai Group ·
The First Real Lidar Winner
Fair Value:US$27.0716.3% undervalued
14 followersusers have followed this narrative
1 commentusers have commented on this narrative
4 likesusers have liked this narrative
TR


tripledub on Taiwan Semiconductor Manufacturing ·
The Most Wonderful Monopoly in the Most Dangerous Neighbourhood on Earth
Fair Value:US$3812.7% undervalued
12 followersusers have followed this narrative
0 commentsusers have commented on this narrative
11 likesusers have liked this narrative
Recently Updated Narratives
RO


Robbo on Visa ·
Visa and the Case for Patience in Premium Businesses
Fair Value:US$2808.7% overvalued
1 followerusers have followed this narrative
0 commentsusers have commented on this narrative
0 likesusers have liked this narrative
EV

evadav on SSE ·
Future Prosperity Awaits with SSE's Impressive 11% Revenue Growth
Fair Value:UK£31.7613.3% undervalued
1 followerusers have followed this narrative
0 commentsusers have commented on this narrative
0 likesusers have liked this narrative
CG

CG86 on Bausch + Lomb ·
$BLCO & $COO The Silence BEFORE the AGM: A Retail Investor’s Timeline, Findings, and Opinion on SUSPICIOUS SILENCE!
Fair Value:US$39.2358.0% undervalued
1 followerusers have followed this narrative
0 commentsusers have commented on this narrative
0 likesusers have liked this narrative
Popular Narratives
TR

tripledub on Microsoft ·
Everyone's Terrified Microsoft Will Keep Spending. I'm Terrified They'll Stop.
Fair Value:US$3956.1% undervalued
45 followersusers have followed this narrative
3 commentsusers have commented on this narrative
42 likesusers have liked this narrative
AN

AnalystConsensusTarget on Microsoft ·
Analyst Commentary Highlights Microsoft AI Momentum and Upward Valuation Amid Growth and Competitive Risks
Fair Value:US$587.3136.9% undervalued
1350 followersusers have followed this narrative
2 commentsusers have commented on this narrative
11 likesusers have liked this narrative
RO

Robbo on Tesla ·
The academically fascinating Tesla
Fair Value:US$301.1k% overvalued
37 followersusers have followed this narrative
11 commentsusers have commented on this narrative
31 likesusers have liked this narrative
Trending Discussion

EL

Element1 on Greatland Resources ·
I can’t believe how inaccurate and out of date this site is—and people rely on it. Greatland owns tw...
0
|0
MI

Mikeymike on Auxly Cannabis Group ·
Id like to understand why they believe the profit margin is going decline so dramatically. Is it ene...
0
|0