ePlus (PLUS) shares have seen some movement lately, with the stock climbing nearly 24% over the past month. Investors are watching to see whether this momentum will continue as market sentiment shifts.
Over the past several months, ePlus has seen strong momentum, with its 1-month share price return of 23% helping lift the stock to $91.51. Despite some recent volatility, the past year’s total shareholder return of 11% reflects steady progress for longer-term investors, and the company’s five-year total return is an impressive 115%.
But with shares trading near their recent highs, the bigger question is whether ePlus still offers upside for new investors or if the market has fully accounted for its growth potential. Is there genuine value left, or is the runway already priced in?
Advertisement
Most Popular Narrative: 15.3% Undervalued
ePlus's fair value estimate, according to the most popular narrative, comes in at $108, well above the recent close of $91.51. This sets the stage for a bold look at what’s driving analyst expectations, beyond near-term price moves.
Persistent demand for AI-powered infrastructure, security, and cloud solutions across industries is expected to accelerate. ePlus's focused investments in AI consultative capabilities and AI-related "plumbing" (compute, networking, security) position the company to capture outsized revenue growth as enterprise adoption of digital transformation initiatives gathers pace.
Want to know the numbers that could justify a premium price for ePlus? The foundation of this narrative is a surprisingly aggressive outlook for future profits and market multiples typically reserved for high-growth tech leaders. Ready to see which crucial assumptions are behind this bullish target? Dive in to uncover the drivers that could reshape expectations around ePlus.
However, there are real risks. These include heavy reliance on large customer deals and margin pressure from a shift in product mix, which could dampen future gains.
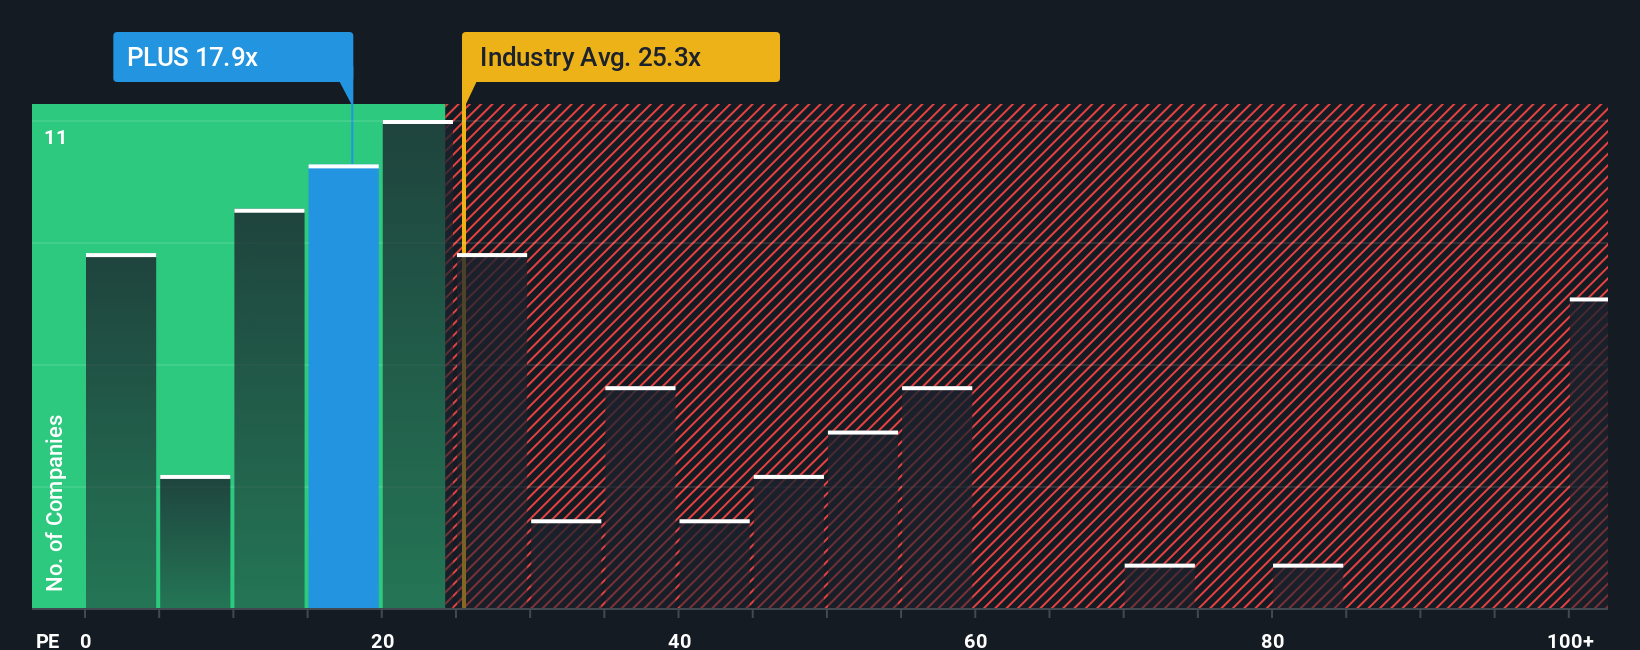
From a different angle, ePlus appears attractively valued when viewed through the lens of its price-to-earnings ratio. The company's ratio is 18.5x, noticeably lower than the US Electronic industry average of 23.4x and also beneath its fair ratio of 20.3x. This relative discount could signal an opportunity, but why might the market still be cautious?
Simply Wall St performs a discounted cash flow (DCF) on every stock in the world every day (check out ePlus for example). We show the entire calculation in full. You can track the result in your watchlist or portfolio and be alerted when this changes, or use our stock screener to discover 926 undervalued stocks based on their cash flows. If you save a screener we even alert you when new companies match - so you never miss a potential opportunity.
Build Your Own ePlus Narrative
If you prefer your own analysis or are curious about alternative storylines, you can craft your own view in just a few minutes by using Do it your way.
A good starting point is our analysis highlighting 2 key rewards investors are optimistic about regarding ePlus.
Ready to Level Up Your Portfolio?
This is your chance to target even more investing opportunities beyond ePlus. Use the Simply Wall Street Screener to focus on unique ways to grow your wealth.
Maximize your income by seeking standout yields with these 16 dividend stocks with yields > 3%, which delivers above-average returns for dividend-focused investors.
Move ahead of the curve and consider investing in the rapidly growing sector by evaluating these 26 AI penny stocks that are positioned for breakthroughs in artificial intelligence.
Increase your potential for returns and identify fast-rising companies by targeting these 3597 penny stocks with strong financials that are already making waves for their financial strength.
This article by Simply Wall St is general in nature. We provide commentary based on historical data
and analyst forecasts only using an unbiased methodology and our articles are not intended to be financial advice. It does not constitute a recommendation to buy or sell any stock, and does not take account of your objectives, or your
financial situation. We aim to bring you long-term focused analysis driven by fundamental data.
Note that our analysis may not factor in the latest price-sensitive company announcements or qualitative material.
Simply Wall St has no position in any stocks mentioned.
New: Manage All Your Stock Portfolios in One Place
We've created the ultimate portfolio companion for stock investors, and it's free.
• Connect an unlimited number of Portfolios and see your total in one currency • Be alerted to new Warning Signs or Risks via email or mobile • Track the Fair Value of your stocks
Provides information technology (IT) solutions that enable organizations to optimize IT environment and supply chain processes in the United States and internationally.