Advertisement
- United States
- /
- Communications
- /
- NasdaqGS:HLIT
Is Harmonic a Hidden Opportunity After Its 14% Drop and Industry Partnerships?

Simply Wall St
Reviewed by Bailey Pemberton
- Curious if Harmonic stock might be an undervalued gem or a risky bet? You are in the right place to dig into what really drives its price.
- Harmonic’s share price has seen some volatility lately, dropping 7.9% over the past week and 14.3% in the last month. This movement may have caught the attention of both bargain hunters and cautious investors.
- Industry watchers have noted a recent uptick in mergers and significant partnerships among technology peers. These developments could explain some of the movement in Harmonic’s stock as investors recalibrate expectations for the sector. News highlighting increased competition and new regulatory developments has also fueled speculation about the company’s positioning and future prospects.
- On our simple value checklist, Harmonic scores a solid 5 out of 6, suggesting it is undervalued against several key benchmarks. We will break down these valuation approaches next, and you’ll get a unique perspective that could help you see the whole value picture more clearly by the end of this article.
Find out why Harmonic's -28.6% return over the last year is lagging behind its peers.
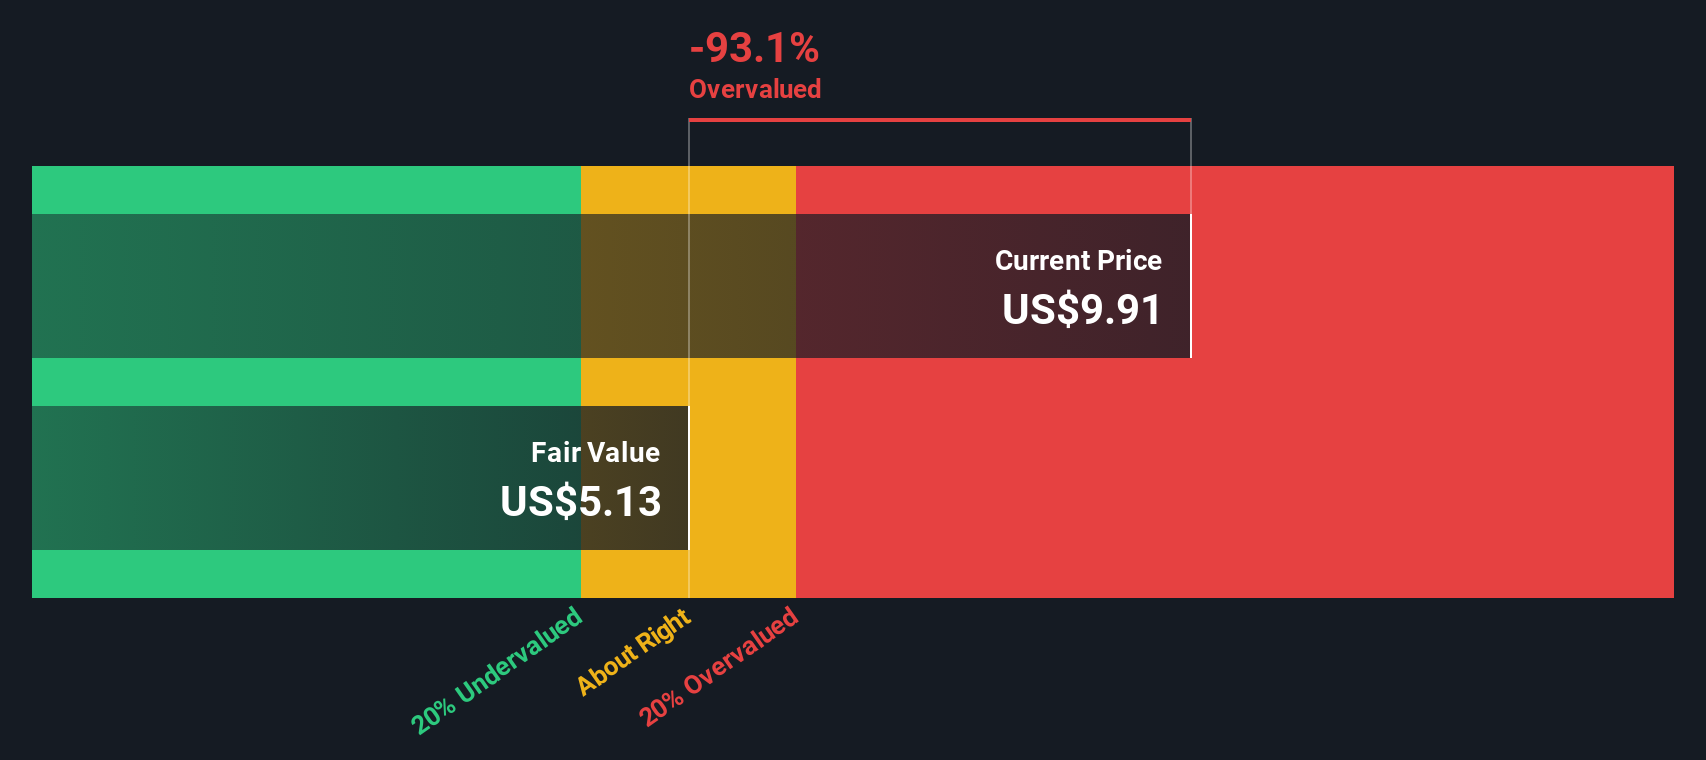
Approach 1: Harmonic Discounted Cash Flow (DCF) Analysis
A Discounted Cash Flow (DCF) model estimates the intrinsic value of a company by projecting its future cash flows and discounting them back to today’s dollars. This approach helps investors understand what the business is worth based on its expected ability to generate cash, rather than simply relying on current earnings or market prices.
For Harmonic, the most recent reported Free Cash Flow (FCF) stands at $134.7 million. According to forecasts and extrapolations, annual FCF is projected to grow over the next decade, with estimates reaching $1.5 billion by 2035. Notably, analysts only provide projections up to 2029 (with $749.9 million FCF), after which growth estimates become more speculative.
Based on these cash flow projections, the DCF model calculates Harmonic’s fair value at around $175.13 per share. With the stock currently trading at a significant discount, about 94.9% below this estimated value, the model suggests Harmonic may be dramatically undervalued at current prices.
Result: UNDERVALUED
Our Discounted Cash Flow (DCF) analysis suggests Harmonic is undervalued by 94.9%. Track this in your watchlist or portfolio, or discover 919 more undervalued stocks based on cash flows.
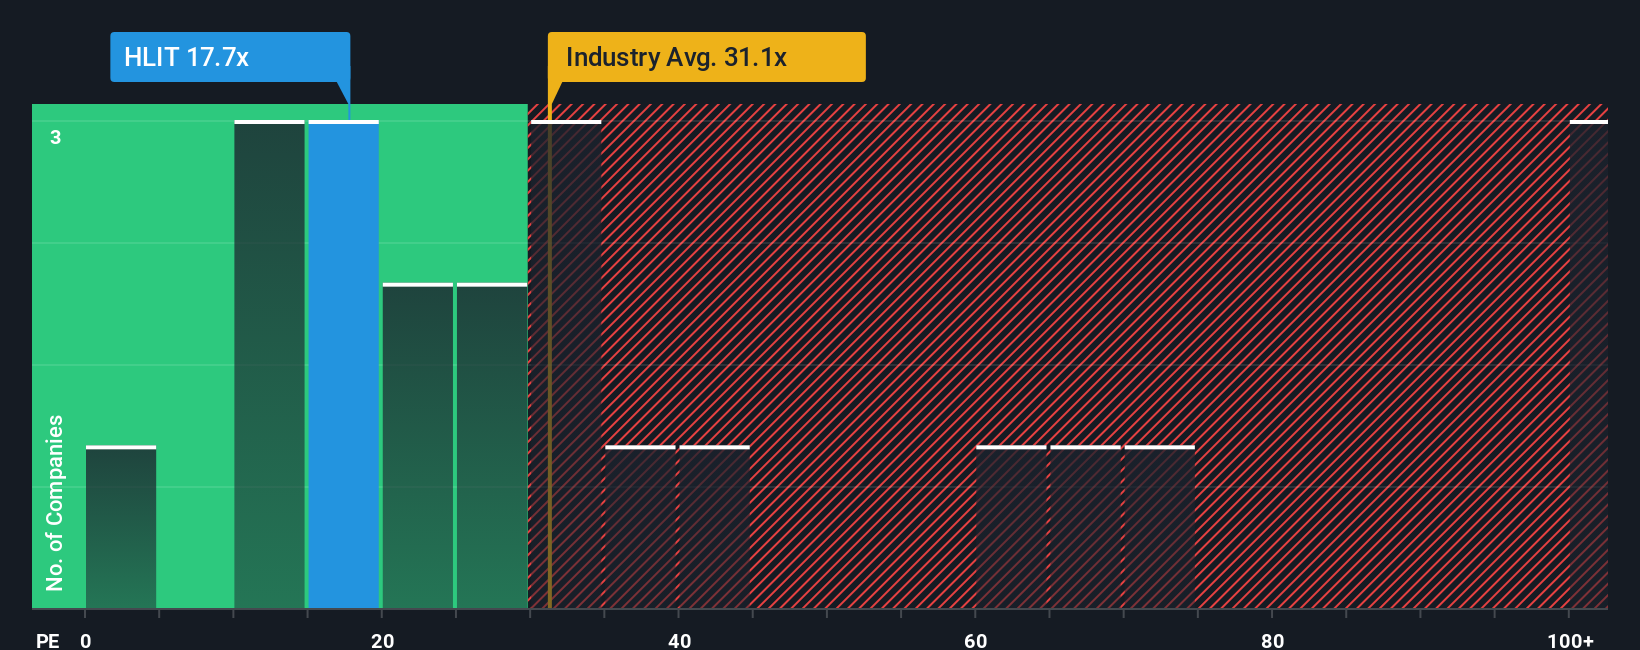
Approach 2: Harmonic Price vs Earnings
The Price-to-Earnings (PE) ratio is a widely used valuation multiple for profitable companies because it relates a company’s stock price to its actual earnings. This makes it ideal for understanding how much investors are willing to pay for each dollar of profit. For businesses like Harmonic that generate consistent earnings, the PE ratio offers valuable insights into whether the stock is cheap or expensive relative to its profitability.
A “normal” or “fair” PE ratio can shift depending on several factors. Companies with higher growth expectations and lower perceived risks tend to command higher PE ratios, while those with slower growth or greater risks usually trade at lower multiples. Comparing these benchmarks helps investors set expectations that align with a company’s prospects.
Currently, Harmonic trades at a PE ratio of 20.0x, which is notably lower than both the Communications industry average of 30.0x and the peer average of 24.3x. While these comparisons are useful, they can be misleading when a company’s growth, profit margins, or business risks are significantly different from its peers. That is where the Simply Wall St “Fair Ratio” comes in. At 40.6x for Harmonic, it incorporates not just industry context, but also factors like the company’s growth outlook, profitability, risk profile, and market capitalization. This approach customizes the benchmark to Harmonic’s unique situation, making it a more precise reference point for valuation.
With Harmonic’s current PE multiple well below its Fair Ratio, the stock appears to be undervalued based on this metric.
Result: UNDERVALUED
PE ratios tell one story, but what if the real opportunity lies elsewhere? Discover 1423 companies where insiders are betting big on explosive growth.
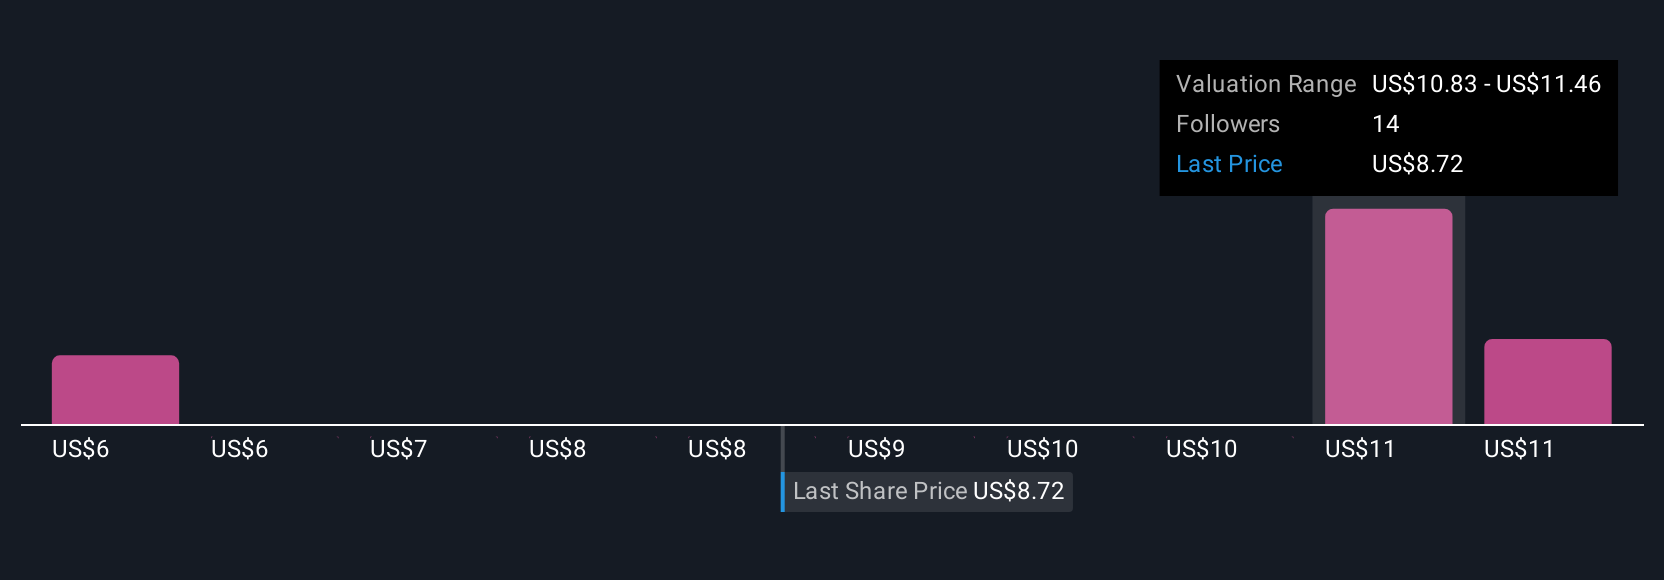
Upgrade Your Decision Making: Choose your Harmonic Narrative
Earlier we mentioned that there is an even better way to understand valuation, so let us introduce you to Narratives. A Narrative is a story you create about a company that connects your personal view of its future, such as your revenue and earnings forecasts, margins, and what you see as fair value, to the numbers. Instead of just relying on ratios, Narratives help you set your own expectations, link them to a financial model, and calculate a fair value grounded in your perspective.
Narratives are available to everyone on the Simply Wall St Community page, where millions of investors contribute their views. They are designed to simplify investment decisions by letting you compare your Fair Value to the current market Price, helping you decide when to buy or sell based on logic and your outlook. Plus, Narratives update automatically as fresh news or earnings data comes in, making your assumptions as dynamic as the market itself.
For example, some investors see Harmonic thriving with revenue hitting $695.5 million and assign a fair value of $12.50, anticipating broadband expansion and SaaS growth. More cautious investors set a fair value as low as $7.00, factoring in execution risks or industry headwinds. Narratives show you this full range, encouraging you to take control of your investment story and act on what you believe.
Do you think there's more to the story for Harmonic? Head over to our Community to see what others are saying!
This article by Simply Wall St is general in nature. We provide commentary based on historical data and analyst forecasts only using an unbiased methodology and our articles are not intended to be financial advice. It does not constitute a recommendation to buy or sell any stock, and does not take account of your objectives, or your financial situation. We aim to bring you long-term focused analysis driven by fundamental data. Note that our analysis may not factor in the latest price-sensitive company announcements or qualitative material. Simply Wall St has no position in any stocks mentioned.
Valuation is complex, but we're here to simplify it.
Discover if Harmonic might be undervalued or overvalued with our detailed analysis, featuring fair value estimates, potential risks, dividends, insider trades, and its financial condition.
Access Free AnalysisHave feedback on this article? Concerned about the content? Get in touch with us directly. Alternatively, email editorial-team@simplywallst.com
About NasdaqGS:HLIT
Flawless balance sheet and undervalued.
Similar Companies
Market Insights

Advertisement
Community Narratives
MicroVision will explode future revenue by 380.37% with a vision towards success
Fair Value US$60.00|98.5% undervalued
TH
Community Contributor
The Indispensable Artery for a New North American Economy
Fair Value CA$132.87|2.3% undervalued
TI
Community Contributor