Advertisement
- United States
- /
- IT
- /
- NYSE:IT
Is There an Opportunity in Gartner After 54.9% Share Price Fall?

Simply Wall St
Reviewed by Bailey Pemberton
- Wondering if Gartner's stock is attractively priced or overhyped? You are not alone, as plenty of investors are searching for clues about its true value.
- After an up-and-down year, Gartner's share price has fallen 54.9% over the last 12 months. However, it has recovered a respectable 1.4% over the past week, hinting at shifting investor sentiment.
- Recent headlines have focused on renewed demand for digital transformation services and Gartner's strategic client acquisitions. These developments appear to be fueling speculation about a possible turnaround and stabilizing the share price. The market is also watching as management seeks to capitalize on new business intelligence trends.
- In detail, Gartner scores a 4 out of 6 on our valuation checks, indicating it is undervalued in several key areas. Next, we will explore how we arrive at that score using popular valuation methods and reveal an even more insightful way to assess Gartner's real worth at the end of the article.
Find out why Gartner's -54.9% return over the last year is lagging behind its peers.
Approach 1: Gartner Discounted Cash Flow (DCF) Analysis
The Discounted Cash Flow (DCF) model estimates a company's true value by projecting its future cash flows and discounting them back to today's dollars. For Gartner, this method uses free cash flow figures and analyst growth assumptions to model a likely trajectory for the business.
Over the last twelve months, Gartner generated free cash flow of $1.21 billion. Analysts anticipate continued growth, projecting Gartner's free cash flow to reach approximately $1.32 billion by the end of 2027. Beyond 2027, Simply Wall St extrapolates annual increases in free cash flow and forecasts it to climb to $1.71 billion by 2035. All projections and valuations are denominated in $.
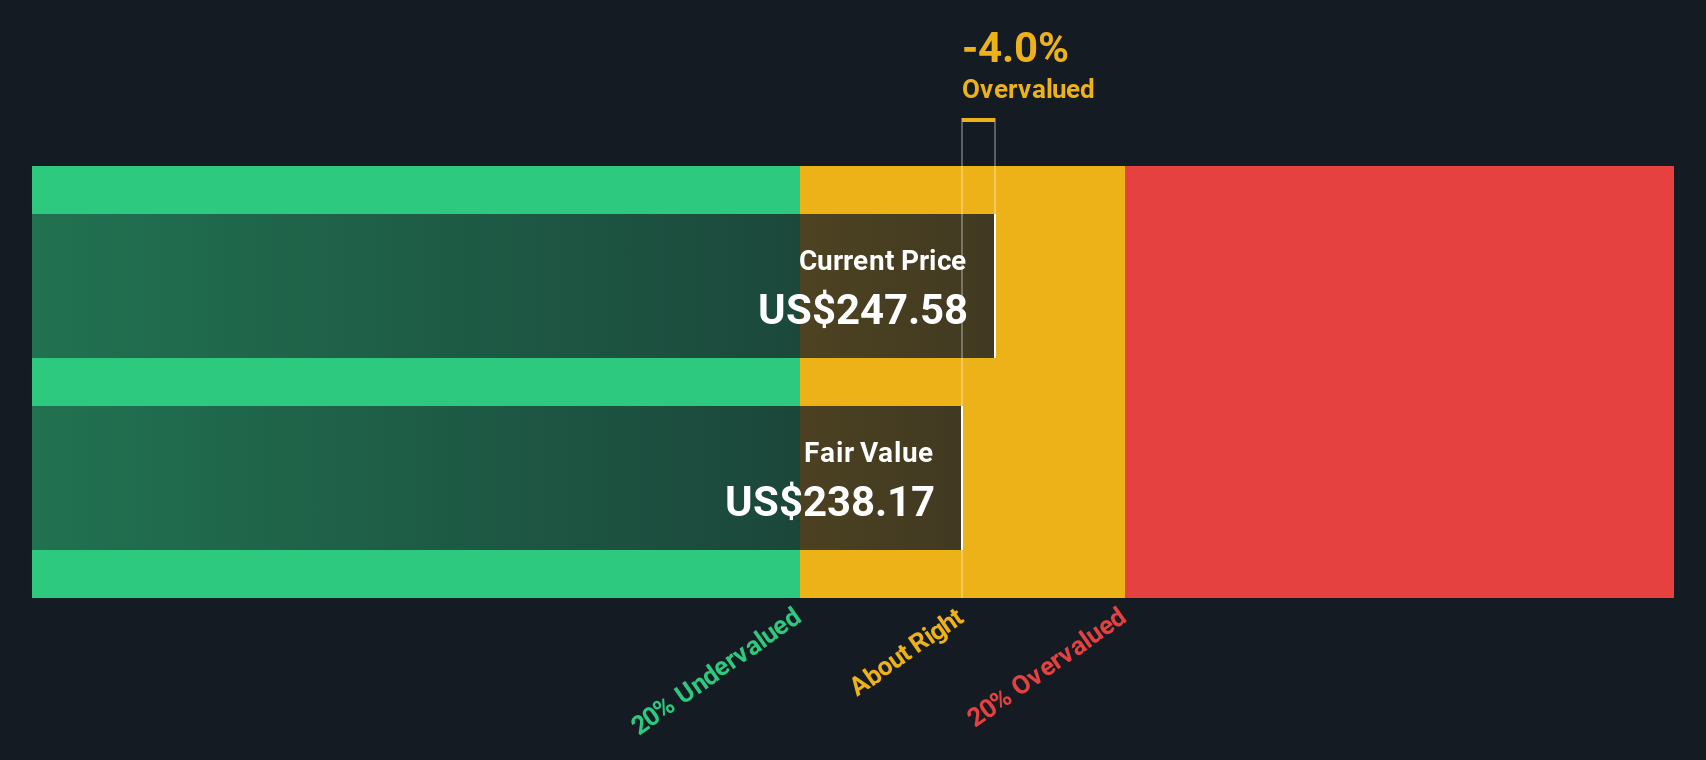
By discounting these future cash flows back to the present, the DCF model arrives at a fair value estimate for Gartner shares of $287.34. This represents an 18.5% discount, suggesting the stock is currently undervalued by a meaningful margin compared to its present market price.
Result: UNDERVALUED
Our Discounted Cash Flow (DCF) analysis suggests Gartner is undervalued by 18.5%. Track this in your watchlist or portfolio, or discover 926 more undervalued stocks based on cash flows.
Approach 2: Gartner Price vs Earnings (PE Ratio)
The Price-to-Earnings (PE) ratio is a commonly used valuation metric for profitable companies like Gartner because it shows how much investors are willing to pay for each dollar of earnings. It is particularly relevant for businesses with consistent profits, giving a quick sense of whether a stock is cheap or expensive relative to its earnings.
Growth expectations and company risk play a major role in deciding what a "normal" or "fair" PE ratio should be. Fast-growing and less risky companies can justify higher PE ratios, while slower, riskier businesses usually trade at lower multiples.
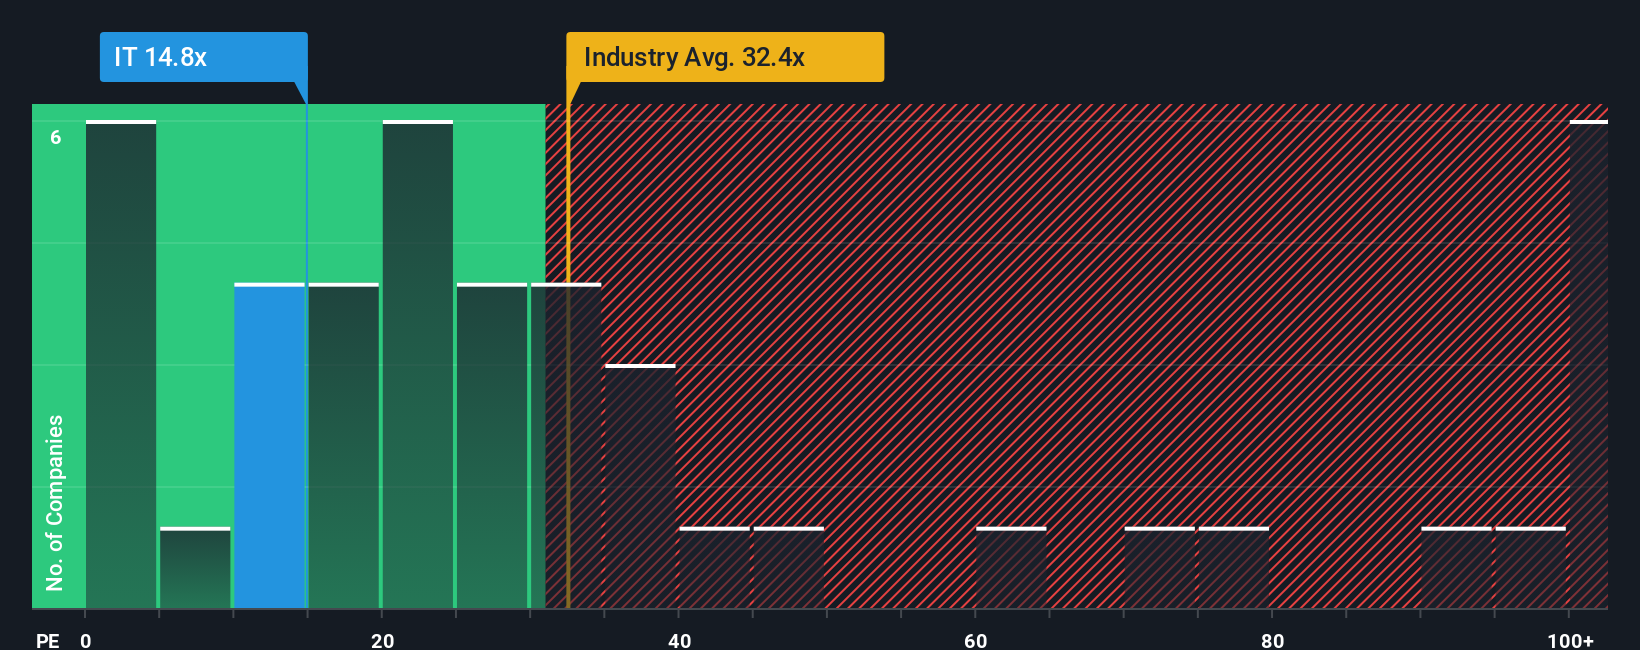
Currently, Gartner trades at a PE ratio of 19.06x. For comparison, the IT industry average is 27.77x, while its close peers average a PE of 21.79x. This puts Gartner noticeably below these benchmarks, which could suggest its shares are undervalued if all else were equal.
However, Simply Wall St's proprietary “Fair Ratio” adjusts for important factors like earnings growth, profit margins, market cap, and company-specific risks. For Gartner, the Fair Ratio is 30.96x. This approach goes a step beyond the typical industry or peer comparison by offering a more tailored and holistic benchmark for what the PE ratio should be, rather than relying purely on broad averages.
Comparing Gartner’s actual PE of 19.06x with the Fair Ratio of 30.96x, the stock appears to be undervalued based on this deeper analysis.
Result: UNDERVALUED
PE ratios tell one story, but what if the real opportunity lies elsewhere? Discover 1430 companies where insiders are betting big on explosive growth.
Upgrade Your Decision Making: Choose your Gartner Narrative
Earlier we mentioned that there is an even better way to understand valuation, so let's introduce you to Narratives, a smarter, more dynamic way to invest. A Narrative goes beyond just numbers; it is your personal take on a company, where you blend your story and assumptions with concrete financial forecasts to determine your own fair value for Gartner. Narratives make investing accessible and interactive by connecting your perspective about Gartner’s future to clear, trackable estimates of revenue, profits, and margins.
On Simply Wall St’s Community page, you can easily create, view, and update Narratives, similar to millions of other investors. These Narratives empower you to make better buy or sell decisions by letting you directly compare your calculated Fair Value with the current market price. The real benefit is that Narratives respond dynamically: as new information or earnings come out, your Narrative and fair value update automatically, helping you react quickly and confidently.
For Gartner, you might base a bullish Narrative on strong AI adoption and margin expansion, resulting in a higher fair value estimate. A more cautious investor could emphasize risk from generative AI and slowing subscription growth, arriving at a much lower fair value. This demonstrates just how flexible and insightful Narratives can be in shaping your investment strategy.
Do you think there's more to the story for Gartner? Head over to our Community to see what others are saying!
This article by Simply Wall St is general in nature. We provide commentary based on historical data and analyst forecasts only using an unbiased methodology and our articles are not intended to be financial advice. It does not constitute a recommendation to buy or sell any stock, and does not take account of your objectives, or your financial situation. We aim to bring you long-term focused analysis driven by fundamental data. Note that our analysis may not factor in the latest price-sensitive company announcements or qualitative material. Simply Wall St has no position in any stocks mentioned.
New: Manage All Your Stock Portfolios in One Place
We've created the ultimate portfolio companion for stock investors, and it's free.
• Connect an unlimited number of Portfolios and see your total in one currency
• Be alerted to new Warning Signs or Risks via email or mobile
• Track the Fair Value of your stocks
Have feedback on this article? Concerned about the content? Get in touch with us directly. Alternatively, email editorial-team@simplywallst.com
About NYSE:IT
Gartner
Operates as a research and advisory company in the United States, Canada, Europe, the Middle East, Africa, and internationally.
Good value with limited growth.
Similar Companies
Market Insights

Advertisement
Community Narratives
MicroVision will explode future revenue by 380.37% with a vision towards success
Fair Value US$60.00|98.4% undervalued
TH
Community Contributor
The Indispensable Artery for a New North American Economy
Fair Value CA$132.87|1.3% undervalued
TI
Community Contributor