Advertisement
- United States
- /
- Software
- /
- NYSE:DT
How Dynatrace’s AI Observability Push Impacts Its Current Valuation

Simply Wall St
Reviewed by Bailey Pemberton
If you’re weighing what to do with Dynatrace right now, you’re in good company, since this stock has been turning a few heads lately. After a bumpy start to 2024, Dynatrace shares have perked up, climbing 4.5% over the past week and month. There’s still ground to cover after a mild setback, with year-to-date and one-year returns hovering around -7%. However, when you zoom out to three or five years, you’ll see gains north of 40%. This shows that long-term believers have been rewarded.
What’s got investors reconsidering Dynatrace? Recently, the company made headlines with its ongoing push into AI-powered observability, expanding partnerships and deepening its relationship with cloud heavyweights. This strategic momentum is being noticed by the market and is subtly shifting perceptions about its risk and growth potential. The renewed interest and positive price traction come even as broader tech names move sideways.
Now, here’s where things get interesting for anyone focused on value. Dynatrace just posted a value score of 5 out of 6, indicating the company is undervalued in nearly all key checks analysts care about. For context, each of these six checks looks at a different slice of what makes a company attractively priced, so landing a 5 means Dynatrace stands out among its peers.
Let’s break down what’s driving that valuation score and why some traditional approaches might actually miss the bigger picture. Stick around for a take on how to gauge Dynatrace’s real worth that goes beyond the usual numbers.
Why Dynatrace is lagging behind its peers
Approach 1: Dynatrace Discounted Cash Flow (DCF) Analysis
The Discounted Cash Flow (DCF) model estimates a company's true worth by projecting future cash flows and discounting them back to today's dollars. It helps investors look beyond short-term noise and focus on the long-term value that the business will generate in cash.
For Dynatrace, the current Free Cash Flow (FCF) stands at $464 million. Analyst forecasts extend over the next five years, indicating steady growth, and projections from Simply Wall St continue this trend. By 2030, Dynatrace's annual FCF is projected to reach approximately $1.1 billion. This consistent path supports the calculation of its intrinsic value.
Based on these cash flow estimates, the DCF model places Dynatrace’s fair value at $72 per share. With the stock currently trading at a discount of 30.1 percent to this fair value, the DCF analysis suggests that Dynatrace is significantly undervalued compared to its long-term cash-generating potential.
Result: UNDERVALUED
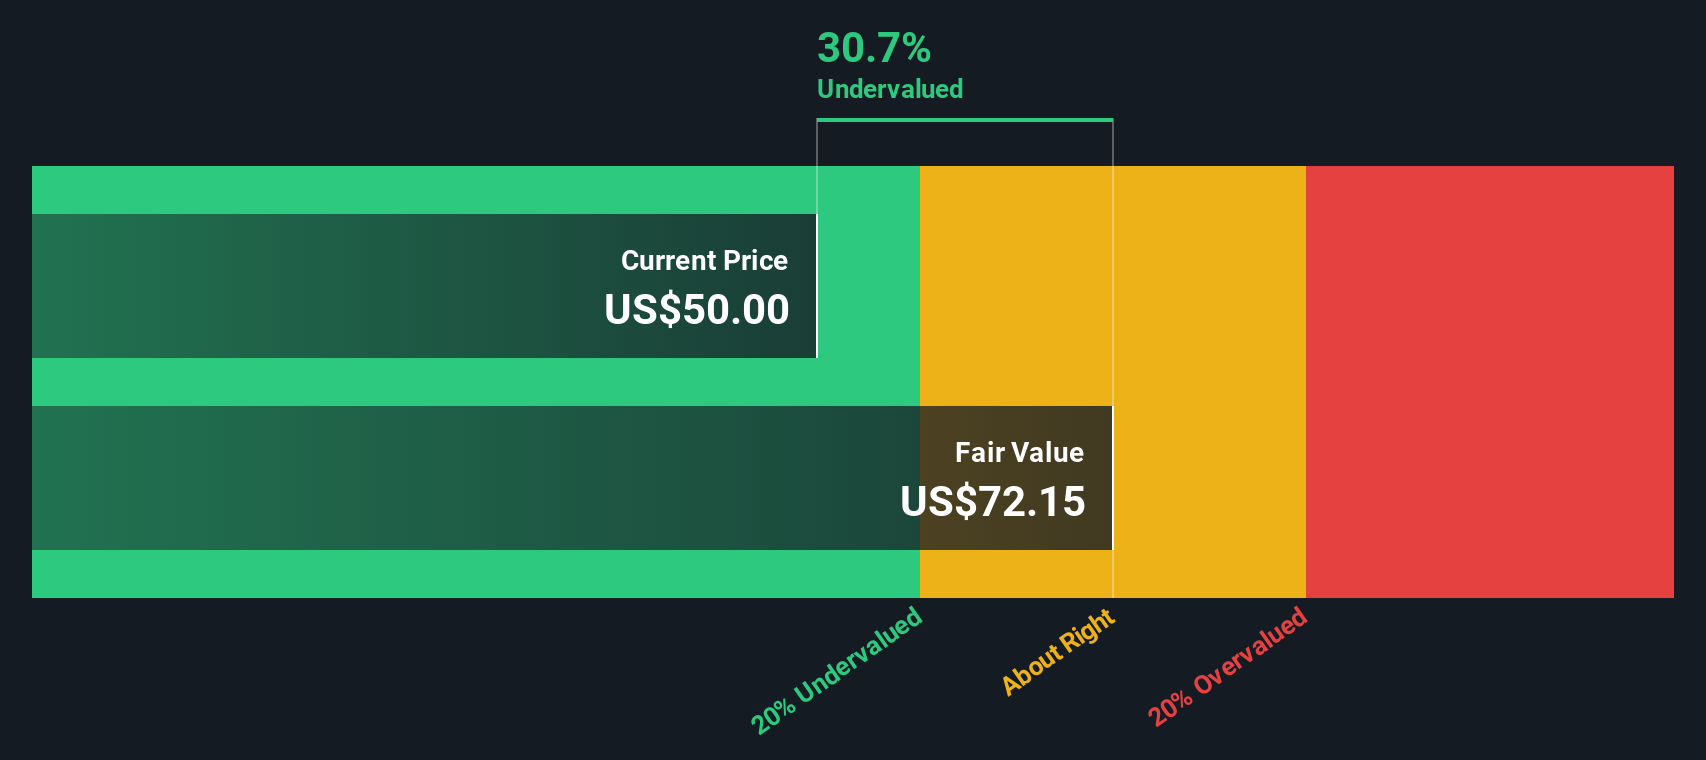
Our Discounted Cash Flow (DCF) analysis suggests Dynatrace is undervalued by 30.1%. Track this in your watchlist or portfolio, or discover more undervalued stocks.
Approach 2: Dynatrace Price vs Earnings
When a company like Dynatrace is steadily profitable, using the Price-to-Earnings (PE) ratio is a time-tested way to value its shares. The PE ratio puts the current share price in context with its earnings, making it easier to see if the market thinks future growth or risk justify a higher or lower valuation.
Growth expectations and risk both factor into what counts as a "fair" PE for any company. If investors believe a company will grow earnings rapidly, or if the risk of its business model is low, a higher PE is justified. Conversely, slow growth or higher risk often mean the stock should trade at a lower PE.
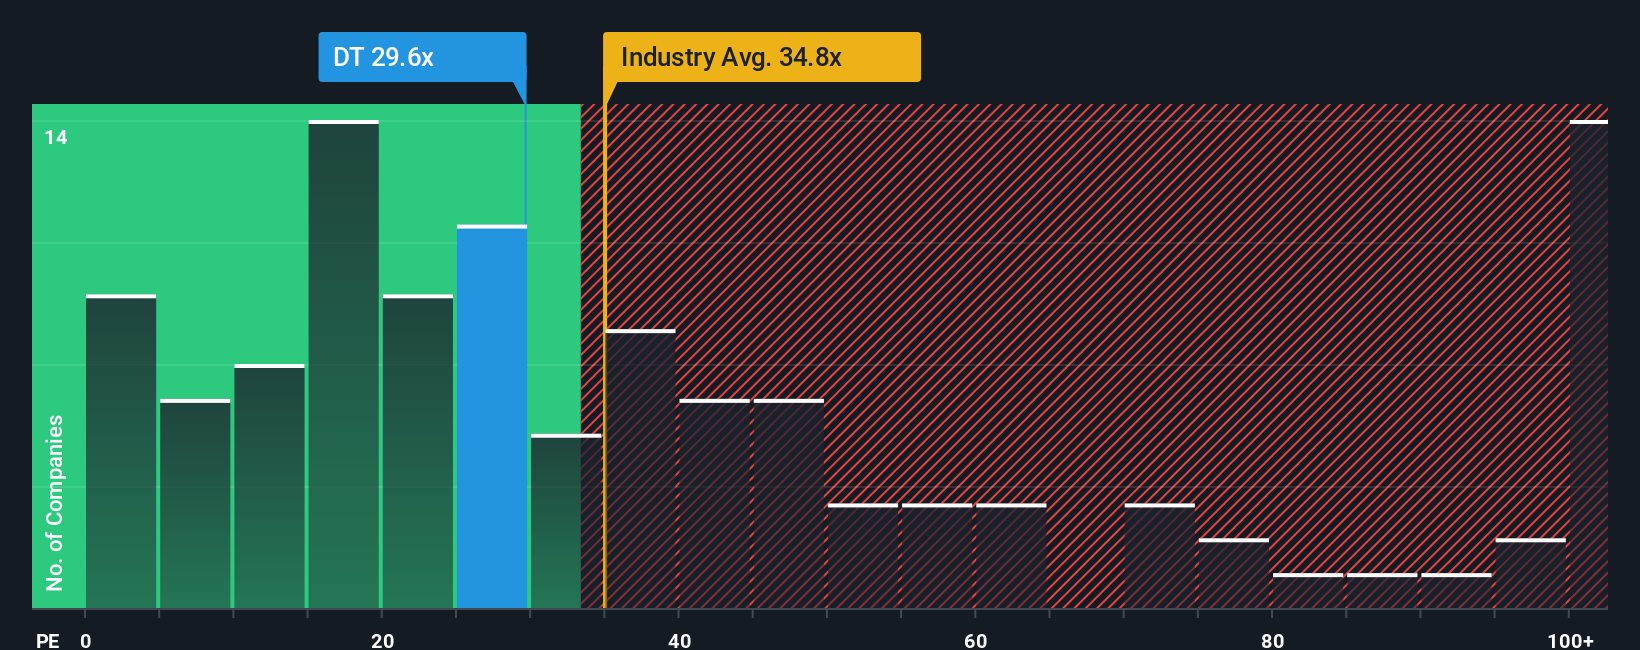
Right now, Dynatrace trades at a PE of 30.8x. That is slightly below the software industry average of 33.3x and well beneath the 67.4x average for its closest peers. However, Simply Wall St brings a more tailored approach with its Fair Ratio, in this case 28.1x, which factors in Dynatrace’s earnings growth, profit margins, industry position, and risk profile. This proprietary metric is a step ahead of simple peer or sector averages as it considers the company’s unique outlook and fundamentals rather than just lumping it in with the broader market.
Comparing the actual PE of 30.8x to the Fair Ratio of 28.1x shows Dynatrace is trading slightly above what would be considered perfectly fair value, but not by much.
Result: ABOUT RIGHT
PE ratios tell one story, but what if the real opportunity lies elsewhere? Discover companies where insiders are betting big on explosive growth.
Upgrade Your Decision Making: Choose your Dynatrace Narrative
Earlier we mentioned that there is an even better way to understand valuation, so let’s introduce you to Narratives. A Narrative is a simple yet powerful tool that lets investors connect the story of a company, such as Dynatrace’s role in digital transformation and AI observability, to their own expectations for future revenue, profits, and margins. It then links those forecasts to a Fair Value.
Rather than relying solely on ratios or analyst targets, Narratives allow you to build your own view of Dynatrace's future by combining what you know about industry catalysts, risks, and financials into a story that is uniquely yours. Available on the Simply Wall St Community page, Narratives make complex analysis accessible to everyone by letting you track your assumptions, see how your Fair Value compares to the current price, and decide if it is time to buy or sell.
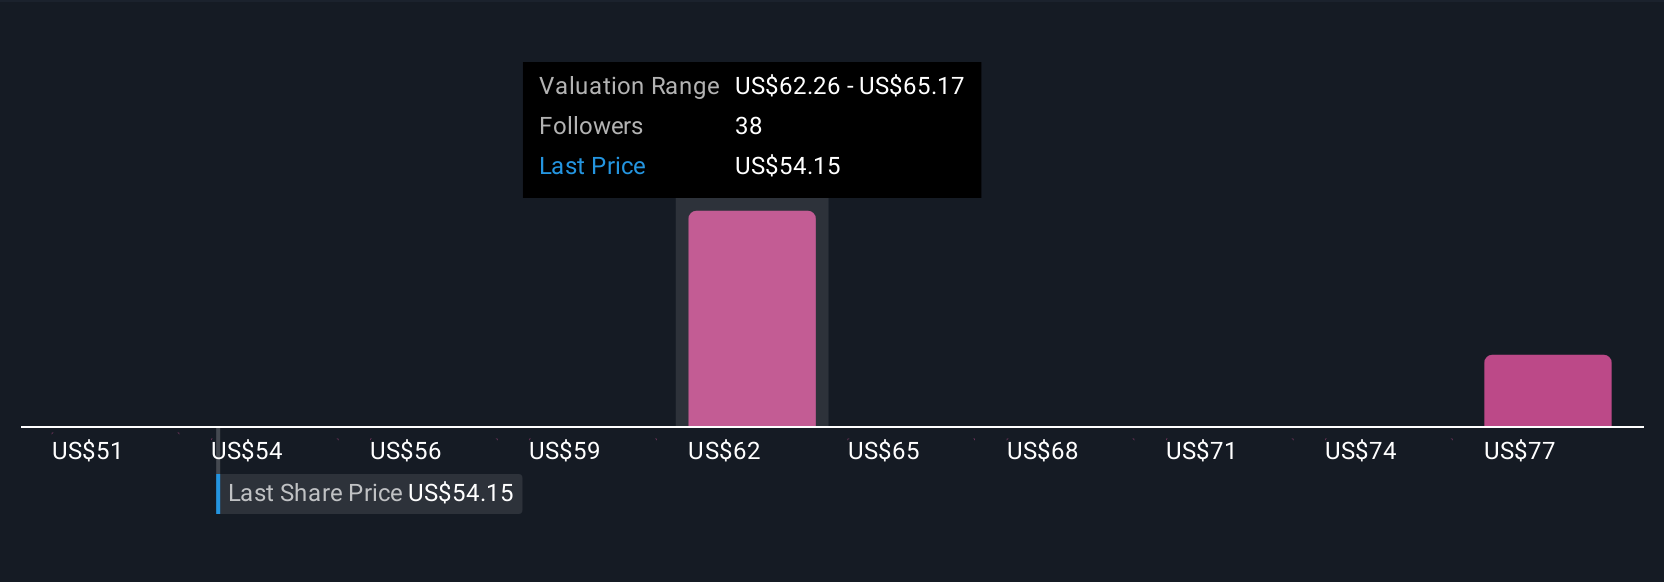
What makes Narratives especially useful is how they are kept up to date. Whenever new data such as earnings reports or major news comes in, your Narrative reflects it automatically, ensuring your investment thesis is always current. For example, some investors might expect Dynatrace to reach as high as $70 per share if growth outpaces expectations, while others might be more cautious, seeing $55 as fair value in a more competitive environment.
Do you think there's more to the story for Dynatrace? Create your own Narrative to let the Community know!
This article by Simply Wall St is general in nature. We provide commentary based on historical data and analyst forecasts only using an unbiased methodology and our articles are not intended to be financial advice. It does not constitute a recommendation to buy or sell any stock, and does not take account of your objectives, or your financial situation. We aim to bring you long-term focused analysis driven by fundamental data. Note that our analysis may not factor in the latest price-sensitive company announcements or qualitative material. Simply Wall St has no position in any stocks mentioned.
New: Manage All Your Stock Portfolios in One Place
We've created the ultimate portfolio companion for stock investors, and it's free.
• Connect an unlimited number of Portfolios and see your total in one currency
• Be alerted to new Warning Signs or Risks via email or mobile
• Track the Fair Value of your stocks
Have feedback on this article? Concerned about the content? Get in touch with us directly. Alternatively, email editorial-team@simplywallst.com
About NYSE:DT
Dynatrace
Engages in the advancement of observability for digital businesses, which transforms the complexity of modern digital ecosystems in North America, Europe, the Middle East, Africa, the Asia Pacific, and Latin America.
Very undervalued with flawless balance sheet.
Similar Companies
Market Insights

Advertisement
Community Narratives
The company that turned a verb into a global necessity and basically runs the modern internet, digital ads, smartphones, maps, and AI.
Fair Value US$300.00|7.1% undervalued
OS
Community Contributor
Flowers Foods Pays A Fair Price For Health
Fair Value US$16.12|26.4% undervalued
NV
Community Contributor
TMX Group will thrive with 33.3% profit margin and enduring market moat
Fair Value CA$49.90|0.8% overvalued
LI
Community Contributor
The "Molecular Pencil": Why Beam's Technology is Built to Win
Fair Value US$65.01|65.8% undervalued
DA
Community Contributor