Advertisement
- United States
- /
- Software
- /
- NasdaqGS:TTAN
Is ServiceTitan (TTAN) Overvalued? A Fresh Look at Valuation After Recent Trading Quietness

Simply Wall St
Reviewed by Simply Wall St
ServiceTitan (TTAN) stock has moved slightly in recent sessions, with no major headlines or announcements driving activity. Investors seem to be weighing ongoing business fundamentals alongside recent price action and longer-term performance trends.
See our latest analysis for ServiceTitan.
With ServiceTitan’s latest share price at $94.25, short-term swings have left it a touch lower than where it started the year, with a 7.1% year-to-date share price return. While the stock has lost some momentum over the past month, the longer-term growth narrative and prospects for improvement in business performance continue to shape investor sentiment.
If you’re looking for fresh ideas beyond the usual names, now is an ideal moment to broaden your horizons and explore fast growing stocks with high insider ownership
This begs the question: Is ServiceTitan’s recent pullback an opportunity to pick up shares at a discount, or are investors simply recognizing that the stock’s future growth is already reflected in the current price?
Price-to-Sales Ratio of 10.1x: Is it justified?
ServiceTitan’s current price-to-sales (P/S) ratio stands at 10.1x, significantly higher than both the industry average and calculated fair ratios. This suggests the market is pricing in robust expectations.
The price-to-sales ratio tells investors how much they are paying for every dollar of revenue generated by the company. For a software business like ServiceTitan, this metric is useful because software firms can grow revenue quickly, even if profitability lags. This makes P/S a relevant benchmark for market optimism around future growth.
Currently, ServiceTitan’s P/S multiple is more than double the US Software industry average of 4.8x and also exceeds the estimated fair P/S ratio of 6.4x. This substantial premium signals that investors expect stronger future revenue growth or a clear path to improving margins. Unless ServiceTitan delivers on these growth ambitions, the market could reassess the premium at which shares trade.
Explore the SWS fair ratio for ServiceTitan
Result: Price-to-Sales Ratio of 10.1x (OVERVALUED)
However, slowing revenue growth or continued net losses could prompt investors to question ServiceTitan’s premium valuation and reconsider their expectations for future growth.
Find out about the key risks to this ServiceTitan narrative.
Another View: DCF Paints a Different Picture
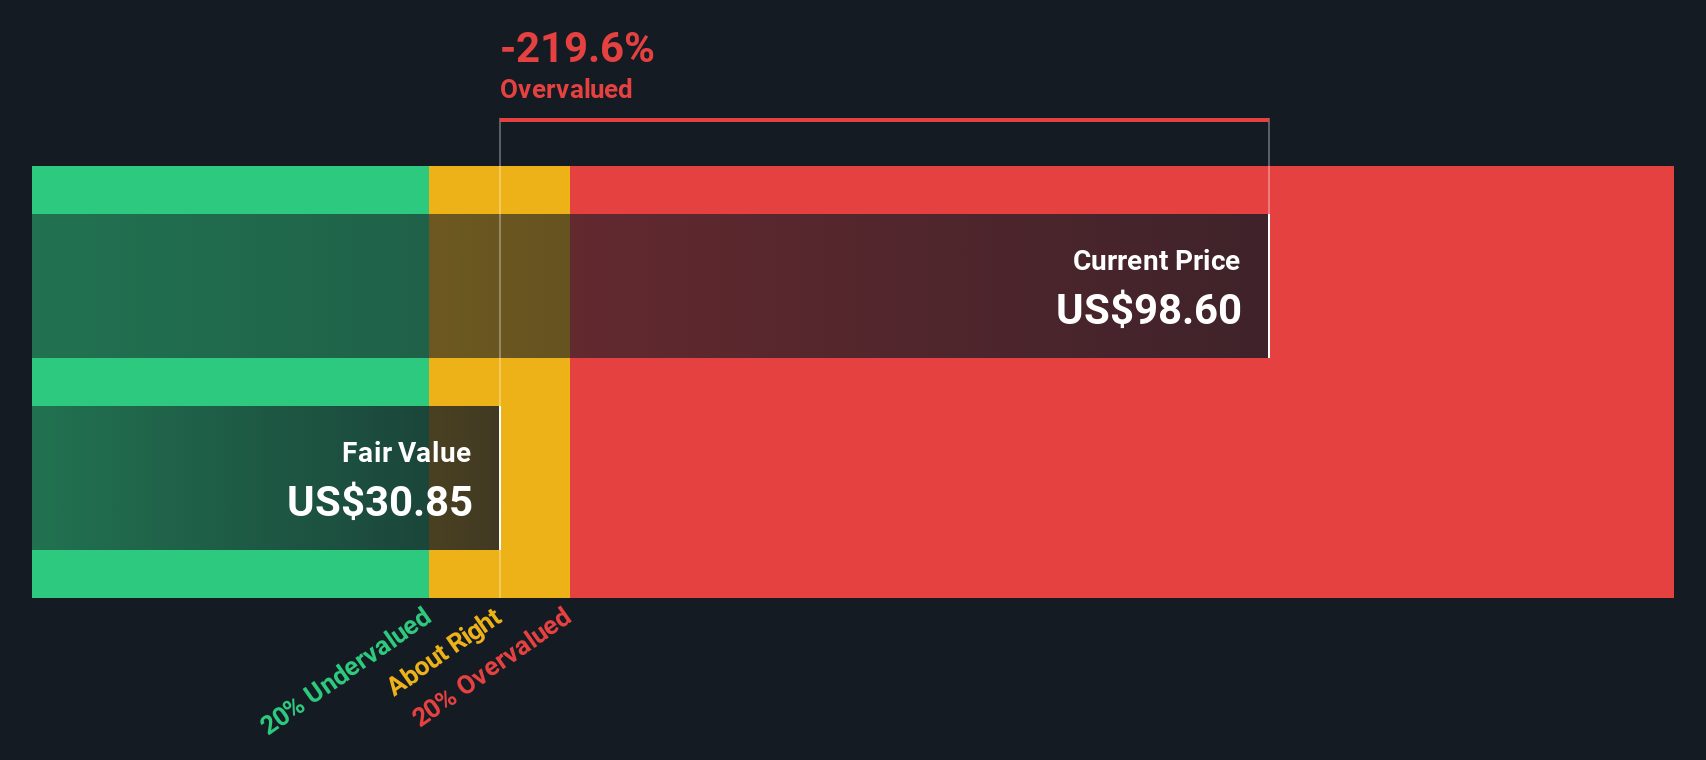
The SWS DCF model tells a very different story. It places ServiceTitan's fair value at just $31.62 per share, which is well below the current price. According to this method, the stock may be overvalued. This raises the question: Are current market expectations overshooting what the numbers justify?
Look into how the SWS DCF model arrives at its fair value.
Simply Wall St performs a discounted cash flow (DCF) on every stock in the world every day (check out ServiceTitan for example). We show the entire calculation in full. You can track the result in your watchlist or portfolio and be alerted when this changes, or use our stock screener to discover 874 undervalued stocks based on their cash flows. If you save a screener we even alert you when new companies match - so you never miss a potential opportunity.
Build Your Own ServiceTitan Narrative
If you see things differently or want to put your own findings to the test, you can build a personalized take on ServiceTitan’s outlook in just minutes. Do it your way
A great starting point for your ServiceTitan research is our analysis highlighting 3 key rewards and 2 important warning signs that could impact your investment decision.
Looking for more investment ideas?
Smart investors don’t just watch one stock; they keep new opportunities in sight. Let Simply Wall Street’s powerful screener help you spot your next winner.
- Capture the growth potential of healthcare technology breakthroughs by exploring these 32 healthcare AI stocks to find companies at the intersection of medicine and artificial intelligence.
- Supercharge your portfolio with recurring passive income by seizing the chance to identify these 16 dividend stocks with yields > 3% offering yields over 3%.
- Gain an edge on tomorrow’s biggest winners by identifying these 3589 penny stocks with strong financials with robust financials before the rest of the market catches on.
This article by Simply Wall St is general in nature. We provide commentary based on historical data and analyst forecasts only using an unbiased methodology and our articles are not intended to be financial advice. It does not constitute a recommendation to buy or sell any stock, and does not take account of your objectives, or your financial situation. We aim to bring you long-term focused analysis driven by fundamental data. Note that our analysis may not factor in the latest price-sensitive company announcements or qualitative material. Simply Wall St has no position in any stocks mentioned.
New: Manage All Your Stock Portfolios in One Place
We've created the ultimate portfolio companion for stock investors, and it's free.
• Connect an unlimited number of Portfolios and see your total in one currency
• Be alerted to new Warning Signs or Risks via email or mobile
• Track the Fair Value of your stocks
Have feedback on this article? Concerned about the content? Get in touch with us directly. Alternatively, email editorial-team@simplywallst.com
About NasdaqGS:TTAN
ServiceTitan
Provides an end-to-end cloud-based software platform in the United States and Canada.
Excellent balance sheet and slightly overvalued.
Similar Companies
Market Insights

Advertisement
Community Narratives
The company that turned a verb into a global necessity and basically runs the modern internet, digital ads, smartphones, maps, and AI.
Fair Value US$300.00|7.1% undervalued
OS
Community Contributor
Flowers Foods Pays A Fair Price For Health
Fair Value US$16.12|26.4% undervalued
NV
Community Contributor
TMX Group will thrive with 33.3% profit margin and enduring market moat
Fair Value CA$49.90|0.8% overvalued
LI
Community Contributor
The "Molecular Pencil": Why Beam's Technology is Built to Win
Fair Value US$65.01|65.8% undervalued
DA
Community Contributor